Alpaca Trading API Review: 30 Days of Probes, and a Benchmark That Measured Its Own sleep()
Our Alpaca trading API review: 22 surviving paper-endpoint probe files, zero errors, REST medians near 78 ms, and an order-timing metric we retracted.
Over a 30-day trial from 25 August to 24 September 2026, Alpaca’s paper trading API returned zero errors in all 22 surviving probe files, and its REST endpoints answered with a median of 77.95 ms across 330 timed calls. The order-timing numbers we collected over the same month turned out to be measuring our own probe’s time.sleep(0.5), not Alpaca, so this review retracts them. It reports what the instrument could actually resolve instead.
Everything below comes from one desk, one symbol (KO), one probe a day at about 10:30 ET, and the paper endpoint only. It doesn’t tell you how Alpaca behaves with real money, at other times of day, or over websocket streaming, which this trial never tested.
How the trial was set up
The method was written down on day one, following our pre-committed trial protocol, and committed on the evening of 25 August together with the output of the trial’s first run, a seed probe that fired about half a minute before the commit. From then on a cron job ran ops/lib/alpaca_probe.py against the paper endpoint every weekday at 10:30 ET. Each run did four things:
- Timed five samples each of the
clock,accountandlatest_tradeendpoints. - Submitted a far-below-market limit buy (KO, qty 1, about 50% of last price), waited for
accepted, then cancelled it and waited forcanceled. - When the market was open, bought $1 notional of KO at market, waited for the fill, and flattened it immediately.
- Recorded rate-limit headers and any errors verbatim.
Raw results land in dated JSON files; nothing is hand-authored. One rig bug from week one does shape the counts below. The probe named its output file by UTC date, so the 25 August seed run (22:13 ET, after the close) was written to 2026-08-26.json and then overwritten by the next morning’s market-hours probe. That makes 23 runs inside the window, of which 22 files survive, starting 26 August. The log recorded the seed run as error-free before it was lost, but its numbers are gone, so every figure below covers the 22 surviving files. The bug itself is covered in backtesting pitfalls with real data. One of the 22 is also a closed-market run: the weekday cron fired on Labor Day (7 September), so the files cover 21 market-open sessions.
Reliability: the clean result
This is the headline, and it holds up. The figures come from the trial log’s closing entry (25 September) and its running totals:
| Measure (22 surviving probe files, 2026-08-26 to 2026-09-24) | Result |
|---|---|
| Probe files / market-open sessions | 22 / 21 |
| Top-level errors | 0 |
| Per-endpoint errors | 0 |
| REST samples timed | 330 |
| Median of all 330 REST samples | 77.95 ms |
| Range of per-probe pooled medians | 70.4 – 104.8 ms (median 78.05 ms) |
| Rate-limit headroom | X-Ratelimit-Limit 200, remaining 199 in each logged run |
| Most status polls any order leg needed | 6 (about 2.9 s, against a 60 s timeout) |
Zero errors in 22 files is a small sample, but a clean one: no surviving run was retried, masked or excluded. The only in-window run missing from it is the overwritten seed probe described above. (The cron kept firing after the trial closed, from 25 September on; those post-trial files aren’t part of the pre-committed window and aren’t counted.) Each run used about one unit of a 200-unit rate budget, so the trial says nothing about behaviour near the limit.
The benchmark that measured its own sleep
For three weeks the log reported order-lifecycle “latencies”: how long an order took to reach accepted, canceled or filled. On 16 September the limit-order accept wait came in at 2,937.0 ms, against the 66–75 ms band the metric had usually sat in. The obvious headline was a vendor slowdown. Before writing it, the desk read its own instrument:
# ops/lib/alpaca_probe.py, the function that produced every order-lifecycle "wait"
def wait_status(oid, want, timeout=60):
    t0 = time.perf_counter()
    while time.perf_counter() - t0 < timeout:
        o, _, _, _ = req("GET", f"{TRADE}/v2/orders/{oid}")
        if o and o.get("status") in want:
            return o["status"], round((time.perf_counter() - t0) * 1000, 1)
        time.sleep(0.5)
    return "timeout", round((time.perf_counter() - t0) * 1000, 1)

# So a reported wait can only land on a grid (illustrative model, fitted in the desk log):
#   wait_ms ≈ n * g + 500 * (n - 1)
#   n = number of status GETs issued, g = one GET's round trip (~71 ms median)
#   n=1 -> ~71 ms   n=2 -> ~643 ms   n=3 -> ~1,214 ms   n=6 -> ~2,928 ms
The function checks the order once, then sleeps half a second between every later check. A wait can only come out near one of the grid values, whatever Alpaca actually did.
The log’s fit of this model over the first 21 probe files accounts for 62 of 62 order legs. The implied per-GET time has a median of 71.0 ms (range 62.4–117.3 ms), which sits inside the separately measured REST band. The 22nd and final probe, on 24 September, found all three of its legs already final on the first check. As far as this instrument can tell, the order path and the REST path run at the same speed.
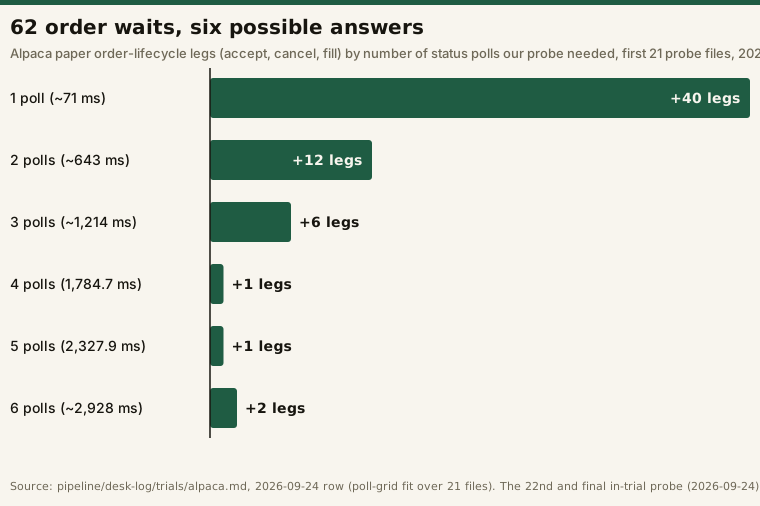
The distribution the log recorded over those 21 files (26 August to 23 September):
| Polls needed | Legs | Wait the grid produces | What the true time could be |
|---|---|---|---|
| 1 | 40 | ~71 ms | Already done on the first check, below the ~70 ms floor |
| 2 | 12 | ~643 ms | Anywhere from ~70 ms to ~640 ms |
| 3 | 6 | ~1,214 ms | Somewhere in a ~570 ms bracket below it |
| 4 | 1 | 1,784.7 ms (23 Sep accept) | Somewhere in a ~570 ms bracket below it |
| 5 | 1 | 2,327.9 ms (23 Sep cancel) | Somewhere in a ~570 ms bracket below it |
| 6 | 2 | 2,937.0 / 2,938.7 ms (16 Sep accept / cancel) | Somewhere in a ~570 ms bracket below it |
- 64.5% of legs are censored. In 40 of 62 cases the order was already in its final state on the first check, so the true time sits below one round trip and the probe didn’t measure it at all.
- The resolution is about eight times coarser than the thing being measured. Each step on the grid is roughly 570 ms wide (the 500 ms sleep plus one ~71 ms round trip), while the round trip it’s trying to resolve is about 70 ms. Any order-lifecycle figure from this trial carries that ±~570 ms quantum. Without it printed next to the number, the figure shouldn’t be quoted.
The 2,937 ms reading on 16 September means the order wasn’t final on five successive checks, not that it took 2.9 seconds.
Two retractions
The desk identified the poll quantization on 2 September and, on 7 September, ruled that no order-lifecycle timing from this rig could be quoted as a vendor latency. Two later log passes read the numbers as vendor behaviour anyway. Both readings are withdrawn:
- “Escalating slowdown.” A mid-trial pass noted the limit-accept poll count running 3 → 2 → 6 across 14–16 September and flagged it as “a direction, not a trend”. The next session came back at 2. The full sequence from 11 to 17 September, 1, 3, 2, 6, 2, is noise on a small lattice, not an escalation.
- “The order clock and the REST clock are not the same clock.” On 21 September the log said the accept wait’s swing (2,937.0 → 645.0 → 653.5 ms) showed an order path far less consistent than REST. That swing is n moving from 6 to 2. The claim is withdrawn.
The probe’s 500 ms sleep wasn’t changed before the trial closed, so no sub-second order-lifecycle figure from this trial is publishable. The fixes are straightforward: a much shorter sleep, backoff starting near zero, or timing the order-update websocket, which was the one path that could have measured this properly and the one the trial left out. A polling loop with a fixed sleep measures its own sleep.
Paper fills: a property of the simulator
The $1 notional KO buys produced 21 fills. Slippage was computed as the fill price against the latest trade price the same probe run had fetched a few seconds earlier:
# Rule used for every fill: $1 notional fractional KO market buy, paper endpoint, ~10:30 ET
slippage_bps = (fill_price - ref_last) / ref_last * 10_000
# Example, 2026-09-23: (88.778 - 88.745) / 88.745 * 10_000 = +3.72 bps| Paper-fill slippage, n = 21 (2026-08-26 to 2026-09-24) | Value |
|---|---|
| Median | +0.34 bps |
| Range | −3.04 to +4.31 bps |
| Fills below the reference last | 8 of 21 |
Paper simulation, not live results, not a prediction, and not advice. These fills come from Alpaca’s paper engine, not from a market. The sample shows the engine filling on both sides of the last trade roughly evenly, and 21 fills are too few to claim a directional bias. They also say nothing about how a live order of a real size would fill. For why a fill assumption can flip a backtest’s verdict, see how we validate a strategy.
What this review does not cover
- Live trading. The probe was bound to the paper endpoint by method, the same boundary described in running an autonomous trading agent. The probe’s written bounds are tabled in our broker MCP servers explainer.
- Websocket streaming, including market data and order updates. It was out of scope in v1 and is untested.
- Other symbols and times. Every probe used KO at about 10:30 ET.
- Sub-second order-lifecycle timing, for the reasons above.
Our TradingView alert latency trial is another case where the rig’s method decided what the number meant.
Frequently asked questions
Is Alpaca’s paper trading API reliable?
In this trial, yes within its limits. All 22 surviving probe files from 26 August to 24 September 2026 show zero top-level and zero per-endpoint errors, and no order leg needed more than six status polls (about 2.9 seconds) against a 60-second timeout. That covers one light request pattern on the paper endpoint, not live trading or streaming.
How fast is the Alpaca API?
Across 330 timed REST calls to the clock, account and latest_trade endpoints, the median was 77.95 ms, with per-probe pooled medians between 70.4 and 104.8 ms. Those were measured from our own machine, so network distance is part of the number.
How long does Alpaca take to accept an order?
This trial can’t answer that precisely. Our probe checked order status with a 500 ms sleep between checks, so in 40 of the 62 legs the log fitted over the first 21 files, the order was already done at the first check (under about 70 ms), and every other reading only places the time within a bracket about 570 ms wide.
Are Alpaca paper fills realistic?
They’re simulated. Across 21 $1 notional KO buys, paper slippage against the last trade ranged from −3.04 to +4.31 bps with a median of +0.34 bps, and 8 fills came in below the reference price. Paper simulation, not live results, not a prediction, and not advice.
Does this site earn anything from Alpaca?
No. There’s no affiliate or referral relationship with Alpaca, and the link on this page is a plain link to the vendor.