TradingView Alert Delay: What 1,170 Timestamped Alerts Actually Measured
Popular guides put TradingView alert delay at 100-300ms. Three fully reconciled sessions on our own webhook rig measured medians near two seconds.
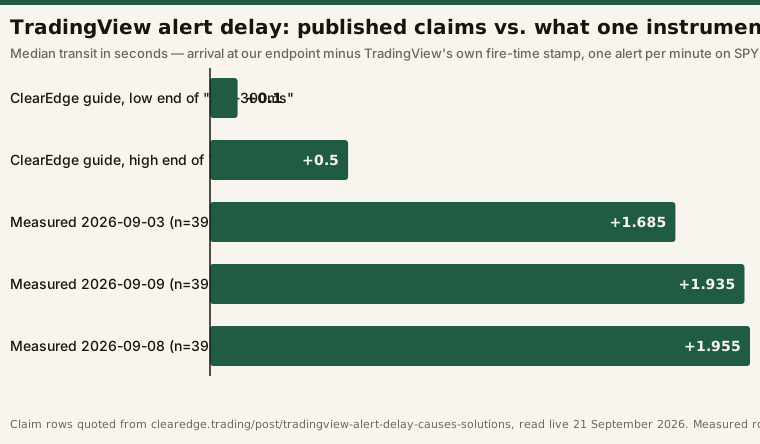
On three fully reconciled sessions this desk measured a median TradingView alert delay of 1.685s, 1.955s and 1.935s — arrival at our endpoint minus TradingView’s own fire-time stamp, 390 of 390 expected minutes captured each time. Measured against the two bands the most-quoted guides on this query publish — “100-300ms” and “100-500 milliseconds” — that is three to twenty times slower on the median, and TradingView’s own webhook documentation states no delivery-time figure at all.
Everything below is one desk, one webhook path, one ticker. It is a measurement of our rig, not a characterisation of the platform — and the section on what the number is not matters more than the number.
The published consensus, and the measurement
The pages that rank for this question agree with each other and disagree with our records. Quoted verbatim, each re-read live on 21 September 2026:
| Source, read 21 Sep 2026 | The claim, verbatim | Our three complete sessions |
|---|---|---|
| clearedge.trading | “Under normal conditions, TradingView alert delays range from 100-300ms from alert trigger to webhook delivery.” | Median 1.685s / 1.955s / 1.935s |
| clearedge.trading | “Most delays range from 100-500 milliseconds under normal conditions, but can spike to 2-5 seconds during high-volume periods or when TradingView servers experience load.” | p95 3.93s / 4.61s / 6.14s |
| pickmytrade.io | “Delivery from TradingView to PickMyTrade is typically near-instant.” | Max 11.68s / 16.22s / 30.13s |
| tradingview.com/support (webhooks) | No delivery-time figure published | — |
Those third-party pages are quoted here as the claim being tested, not as authorities. Neither is a vendor page, neither publishes a method, sample size or date, and neither can be checked. Ours can — which is the only reason this page exists.
The rule behind every number on this page
No statistic here means anything without the procedure that produced it, so here it is in full.
The rig fires exactly one TradingView price alert per minute on SPY for the whole regular session — 13:30:00Z through 19:59:00Z, 390 expected minutes. Each alert posts a webhook carrying TradingView’s own {{timenow}} stamp; the receiver writes one object per arrival with its own receipt time. ops/lib/trial_latency.py then differences the two and reports the session’s percentiles. Smoke-test records carrying a test flag are excluded by design. The plan under test is TradingView’s Essential tier, opened on 23 August 2026 via the platform’s own 30-day free trial — that is what the trial log records, and no payment to TradingView appears anywhere in it. The whole run sits under a pre-committed 30-day trial protocol whose end date, 22 September 2026, was fixed before the first alert fired.
Three sessions and only three are used below. Each captured every one of its 390 expected minutes. Two of the three — 2026-09-03 and 2026-09-08 — were re-fetched in full from object storage on the pass that recorded the third, and reproduced their published stats lines exactly. The 2026-09-09 line is as first computed on that same pass and has not been re-fetched since, so it carries one less check than the two above it:
| Session | Alerts | Median | p95 | Max | Minutes covered |
|---|---|---|---|---|---|
| 2026-09-03 | 390 | 1.685s | 3.93s | 11.68s | 390 of 390 |
| 2026-09-08 | 390 | 1.955s | 4.61s | 16.22s | 390 of 390 |
| 2026-09-09 | 390 | 1.935s | 6.14s | 30.13s | 390 of 390 |
Read the columns against each other rather than down. Across the three the median barely moves — 1.685 → 1.955 → 1.935s, and the last is below the one before it — while the p95 climbs every session (3.93 → 4.61 → 6.14s) and the max nearly triples (11.68 → 16.22 → 30.13s). The middle of the distribution and its tail move independently. A single “average alert latency” figure, which is what every page quoted above publishes, would have concealed both.
Why the denominator is a published column
The coverage column is not padding. One session in this trial produced the fastest latency line of the entire run — and it is worthless, because it captured one minute of 390. That case, and what it says about benchmarks that report percentiles without their sample, is worked through in our TradingView review. It is the reason no percentile on this page appears without the count beside it.
What this number is not: transit, not the wait
This is the most important caveat here, and it is a flaw in our measurement rather than a vendor defect.
# Illustrative — the shape of what ops/lib/trial_latency.py computes.
latency = arrival_time - fired_at      # fired_at = TradingView's own {{timenow}} stamp

# Any delay incurred BEFORE the platform wrote that stamp is invisible to this.
# Because the rig fires on the minute, the same session can be re-measured
# from the minute boundary instead, which captures the whole interval:
latency_total = arrival_time - floor_to_minute(fired_at)
Recomputed both ways on the 390 records of 2026-09-04:
| 2026-09-04, n=390 | Transit (arrival − fired_at) |
Total, from the minute boundary |
|---|---|---|
| Median | 2.067s | 2.664s |
| p95 | 5.43s | 7.90s |
| Max | 16.93s | 24.93s |
Measured from the boundary the median grows by about 29% and the worst delivery by eight seconds. So no figure on this page should be read as the delay a user experiences — only the boundary column even attempts that, and only for one session. Every headline number here is transit.
That cuts both ways for the comparison at the top. Our transit medians already sit three to twenty times above the published bands; the one session re-measured the other way sits higher still. But the guides do not say which definition they use either, which is part of why they are unfalsifiable.
The vendor publishes no number — and one that surprises people
TradingView’s own webhook support page, read live on 21 September 2026, states no delivery time, no latency band and no speed guarantee. What it does state is a constraint pointing the other way: “If a remote server takes longer than three seconds to process a request, the request will be cancelled.” And on reliability, plainly: “Please note that webhooks may occasionally fail to reach the specified URL.”
That three-second rule is a budget on your receiver, not a promise about TradingView’s delivery — and if your endpoint does real work on arrival (broker auth, risk checks, an order round-trip) it is the tighter of the two constraints on most days. It is also the only timing figure the vendor commits to anywhere in that document.
Two findings that live on other pages
Both came out of this same dataset and both have a permanent home elsewhere, so they get a sentence each rather than a retelling:
- Alerts landing on a five-minute clock boundary are measurably slower than the rest — 1.70x, 1.90x and 2.01x the off-boundary median on these same three sessions, n=78 on-boundary alerts each. The distribution, the controls run against it and the single permutation test behind it are in running an autonomous trading agent.
- At coarser boundaries only the direction replicates. The observed top-of-hour penalty ranged from 1.68x to 10.44x across those three sessions — a factor of six on six-observation buckets — so this desk publishes no multiplier there at all.
What we are not claiming
Not a cause. Our rig sends exactly one alert per minute down one webhook path. Nothing in the data separates vendor-side contention from our own plumbing — our receiver, our network, our object store. Every figure here is a property of this measurement, and calling it a TradingView characteristic would be the exact move that makes the pages quoted at the top unusable.
Not a platform benchmark. Three sessions, one ticker, one plan tier, one geography. Every latency figure in this trial is SPY-only.
Not a running tally. The trial is open and every number on this page is stamped to the session that produced it. Each of the three complete sessions above is frozen to its date, and two of the three have been re-computed from a fresh download; later sessions exist and are logged, and this page is deliberately not built on a cumulative count, because a figure that changes every trading morning is a measurement with a timestamp rather than a fact about the platform.
If you trade off alerts, what to do with this
The practical consequence is not “TradingView is slow.” It is that a delivery time you have not measured on your own path is not a number you have — and the published ones are off by an order of magnitude against the only instrumented sample we can check. If an alert-driven process depends on arriving inside a specific window, instrument the window: stamp every arrival, keep the count of expected fires beside the percentiles, and read the tail separately from the median, because on our records they moved in opposite directions on the same session.
Running a rig of this shape needs more alert headroom than a free account carries, which is why the trial runs on the Essential tier at all — opened on the platform’s own 30-day free trial, which is the only arrangement this desk’s log records: TradingView. That is an earning link, and the numbers above are less flattering than the vendor’s marketing and than the guides ranking above it — none of them was softened, and the plan tier boundaries are taken apart separately in free versus paid.
Frequently asked questions
How long do TradingView alerts actually take to arrive?
On this desk’s rig, a median of 1.685s, 1.955s and 1.935s across three sessions of 390 alerts each — measured as arrival minus TradingView’s own fire-time stamp. The p95 on those sessions ran 3.93s to 6.14s and the slowest single delivery was 30.13s. Those are our numbers on our path, not a platform specification.
Why is that so much slower than the 100-300ms figures online?
We do not know, and neither do those pages — none publishes a method, a sample size or a date. Part of the gap may be definitional: our figure measures transit from the vendor’s own timestamp, and the guides do not say what theirs measures. What we can say is that the only instrumented, dated, reproducible sample we hold sits three to twenty times above those bands on the median, not just in the tail.
Does TradingView guarantee a webhook delivery time?
No. Its webhook support page, read on 21 September 2026, publishes no delivery-time figure and warns that “webhooks may occasionally fail to reach the specified URL.” The only timing number on that page is a limit on your own endpoint: a request taking a remote server longer than three seconds to process is cancelled.
Is alert delay a reason not to automate from TradingView?
That depends entirely on the window your process needs, which is why the measurement matters more than the verdict. A rule acting on a daily or hourly bar is untouched by two seconds; one assuming a fill at the price that triggered the alert is not — the class of assumption that only breaks once real market data is involved. The broader category of infrastructure failures that only appear once a strategy runs live is covered in running an autonomous trading agent.
Is this trial finished?
It runs to 22 September 2026 under a protocol fixed in advance, and this page reports only the three sessions that captured every one of their 390 expected minutes — two of which were also re-computed from a fresh download on a later pass. Numbers will change; each one here is stamped to its session so you can tell what is current and what is not.
Educational content, not financial advice. Nothing here recommends any product or any trade. This page carries an affiliate link to TradingView, disclosed above and below. The plan being measured was opened on TradingView’s own 30-day free trial on 23 August 2026 and the desk’s trial log records no payment to the vendor; TradingView has not reviewed, seen or paid for any of this. All latency figures are single-desk measurements on one webhook path, with cause undetermined.