TradingView Review: What Our 30-Day Desk Trial Has Measured So Far
TradingView charts, screener and alerts under a fixed 30-day desk protocol: day 23, ten completed baskets, and the pass our ledger failed to reproduce.
TradingView is a browser-based charting platform with a built-in stock screener, custom alerts and the Pine Script language, sold as a free tier plus four paid ones — the boundaries are in free versus paid. No vendor page can tell you whether it holds up as a desk’s primary platform, so we are running it under a fixed protocol for 30 days and publishing the numbers as they arrive.
Trial status: day 23 of 30, pinned to the 2026-09-14 desk pass, which reads the 2026-09-11 bar; the trial ends 22 September 2026. Every desk figure below is pinned to that named pass rather than carried forward — and naming a pass is not a claim that no later pass exists by the time you read this. The subscription went active on 23 August 2026 on Essential, via that tier’s 30-day free trial. A full session closed on 11 September, so every session-keyed leg of the protocol was recomputed on this pass.
Pinning to a named pass is how numbers roll forward here, and how findings get withdrawn: five claims on this page have been refuted or narrowed by the desk’s own later passes and by our own fact-check — one of them then partly reinstated — and a sixth item is unresolved rather than corrected. All are rewritten below rather than softened. The newest retraction is the largest: this pass could not reproduce its own basket ledger, and two already-published completed returns changed. That section leads with the failure, not with the nine entries that did reproduce.
The protocol, and what each track has produced
The four tracks were written down before the subscription started, so the trial cannot quietly become a search for a flattering result — the reasoning is our tool trial protocol.
| Track | How it is measured | Status at the 2026-09-14 pass |
|---|---|---|
| Screener quality | Daily run of the desk’s momentum preset; top five by relative volume tracked equal-weight for five sessions | Fifteen screens, ten completed baskets — under two ledgers that disagree |
| Alert delivery | A webhook rig timestamps each arrival and differences it against TradingView’s fire-time stamp | 3,898 records, eleven sessions — one of which covered 0.26% of its minutes |
| Reliability | Availability, chart responsiveness and errors during live sessions | No data — no in-platform session logged 23 August to 14 September |
| Friction | Where the paywall interrupts day-to-day use | No data — same reason |
The caveat that matters more than any number here. The regime reads are computed off-platform with our own regime method, and the screen is a public-data replication of the preset across the S&P 500 constituents — it is the desk’s own screen, not TradingView screener output. What follows measures the method, not the platform.
Ten completed baskets, two ledgers that disagree, and no mean
The rule first, because a number without its rule is not a result: from the start-date close, screen the S&P 500 constituents for close above the 20-day SMA and relative volume above 1.5x with a $2B market-cap floor, keep the top five by relative volume, weight them equally, read after each of the next five sessions. The fifth reading is the metric; everything before it is an interim.
Before any of those numbers: on this pass the ledger stopped reproducing. An independent reconstruction from a fresh download returns one more passer than the record on three earlier bars, and on two of them the extra name lands inside the tracked top five and changes a completed, already-published return. The desk log publishes both series side by side and calls neither final. So does this page.
| Basket start bar | As recorded in the ledger | As recomputed on 2026-09-14 | What changed |
|---|---|---|---|
| 2026-08-21 | −3.13% | −3.13% | — |
| 2026-08-24 | +0.61% | +0.61% | — |
| 2026-08-25 | +0.60% | +0.60% | — |
| 2026-08-26 | −0.47% | −1.15% | BBY displaces META; BBY now reads rel-vol 2.0618, the third-highest passer of that bar |
| 2026-08-27 | +2.41% | +2.41% | — |
| 2026-08-28 | −3.20% | −3.20% | — |
| 2026-08-31 | −4.63% | −4.63% | — |
| 2026-09-01 | −1.46% | −1.46% | — |
| 2026-09-02 | −1.20% | −1.84% | CF displaces WFC for the last slot on a 0.018 rel-vol gap (1.7604 vs 1.7426) |
| 2026-09-03 | not yet complete | −4.87% | Completed on this pass |
| Series summary | median −1.20%, mean −1.16%, 6 of 9 negative | median −1.65%, mean −1.67%, 7 of 10 negative |
Neither column is presented as final, and ten baskets is not a performance claim in either version.
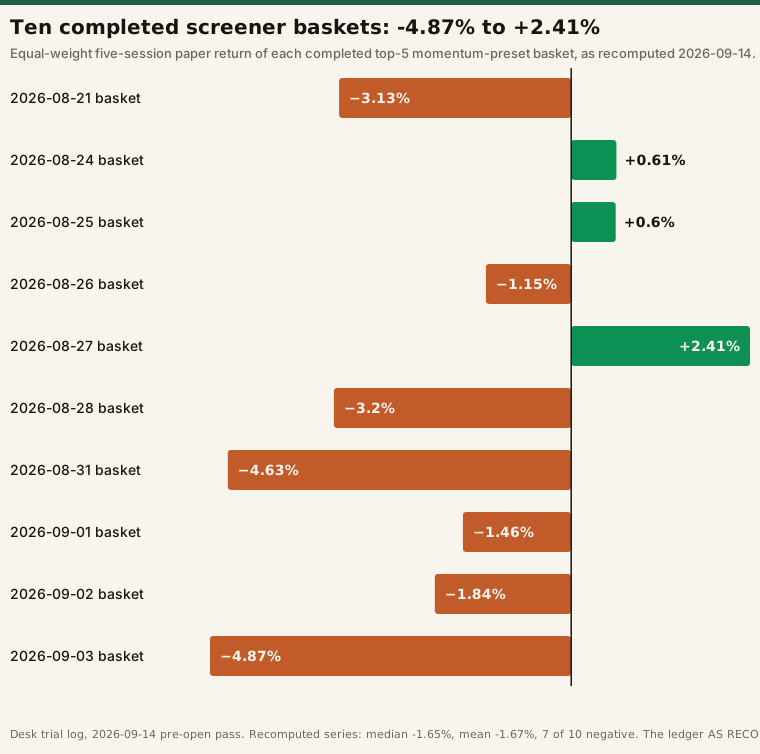
The chart is the metric; the path behind it is the part that argues against reading interims. For the five baskets whose full session-by-session path we hold:
| Sessions held | 08-21 | 08-24 | 08-25 | 08-26 | 08-27 |
|---|---|---|---|---|---|
| 1 | −2.11% | −0.27% | −0.92% | −0.67% | −0.79% |
| 2 | +3.02% | −0.48% | +1.78% | +0.84% | +1.35% |
| 3 | +0.41% | +0.01% | +1.03% | +0.40% | +1.11% |
| 4 | +0.12% | +0.28% | +1.37% | −0.73% | +0.52% |
| 5 — the metric | −3.13% | +0.61% | +0.60% | −0.47% | +2.41% |
The 08-26 column’s final figure is the recorded one. The 2026-09-14 reconstruction returns −1.15% for that basket on a different fifth leg, and the path above was never recomputed on the new legs — so read that column as the ledger’s history, not as a settled number.
The tenth completion arrived on this pass: the 2026-09-03 basket (LULU/ACGL/PFG/HOOD/DELL) finished at −4.87% — legs LULU −18.72, ACGL −3.75, PFG −1.97, HOOD −9.74, DELL +9.86. Its four-session interim read −7.62%, so the last session moved it 2.75 points without changing its sign. A 28.6-point spread separates its best leg from its worst, on a five-name equal-weight basket where one name carries a 20% vote — the construction risk this metric cannot diversify away.
Across the ten completed baskets the median is −1.65% as recomputed and −1.20% as recorded over the nine the ledger holds. We are not publishing the mean as a result, and the reason is the most useful thing in this section. Watch what both summary statistics have done as the sample grew, under an unchanged rule — each one computed from the recorded series printed above the chart:
| Completed baskets | Median of the series | Mean of the series | What the page said at the time |
|---|---|---|---|
| 5 | +0.60% | +0.004% | Reported as a near-zero coincidence |
| 7 | −0.47% | −1.12% | Two additions moved the mean by more than a percentage point |
| 8 | −0.97% | −1.16% | “The ninth will move it again” |
| 9 | −1.20% | −1.16% | It moved the median by 0.23 points and the mean by under half a basis point |
| 10 (recomputed basis) | −1.65% | −1.67% | Not a like-for-like addition: two earlier entries were restated at the same time |
Row 9 is not stabilization and we are not reporting it as such. One basket landing near the running mean moves the mean barely at all; the same basket moved the median by almost a quarter of a point. Which statistic looks steady is a function of where the new observation fell, not of the sample having become large enough to trust. And the last row shows a second way these figures move: not by the sample growing, but by the history being restated underneath it. Ten is still far too few to characterize this preset, and our own trial log says so in as many words. The series is published so the sample can be watched growing; it is not a performance claim about momentum screening, about this preset, or about TradingView.
# Illustrative: the 2026-08-21 basket's metric, exactly as the trial computes it.
# Five-session returns, top-5 by relative volume on the 2026-08-21 bar.
legs = {"MRNA": -4.92, "HOOD": -3.58, "COIN": -4.21, "FCX": -0.27, "DE": -2.65}
assert len(legs) == 5                       # 5-of-5 assertion before averaging
equal_weight = sum(legs.values()) / len(legs)
print(round(equal_weight, 2))               # -> -3.13  (percent)
The assertion is not decoration: two earlier versions of that script were discarded — one averaged over NaNs, one indexed positionally across tickers holding different bar counts.
These are paper measurements of hypothetical equal-weight baskets over the windows stated above: not a trade, not live results, not a prediction and not advice.
The first retraction. An earlier version of this page said three of four completed baskets had interims pointing the wrong way. Once the data gaps below healed, the missing interims filled in and further baskets completed — the session-4 reading now has the same sign as the metric in 4 of the first 5. What survives is weaker: the one-session reading has the opposite sign in 3 of those 5, and paths swing late (08-21 ran +3.02% to −3.13%). We withhold interims because paths are unstable, not because they systematically reverse.
A fourth data hole opened one session after a flawless census
For four passes the public data source the desk pulls from was missing the 2026-08-28 close for almost the whole S&P 500. Then it healed. A second hole — APH’s closes on 1, 2 and 3 September — opened on the pass that recorded the heal, and closed on the one after. A third opened and healed inside the 2026-08-28 basket’s own base bars. And on this pass a fourth one opened:
| Census pass | 2026-08-28 close | 09-01 / 09-02 / 09-03 closes | The 2026-08-28 basket’s five legs |
|---|---|---|---|
| 2026-09-02 | 49 of 505 | not yet censused | not trackable |
| 2026-09-03 | 50 of 505 | not yet censused | not trackable |
| 2026-09-04 | 503 of 503 | 502 of 503 each — APH absent | not trackable |
| 2026-09-07 | not re-censused | 503 of 503 each — APH restored | not trackable |
| 2026-09-09 | 503 of 503 | 503 of 503 | all five returned — basket completes at −3.20% |
| 2026-09-10 | 503 of 503, zero missing bars | 503 of 503 | Every leg of all 13 baskets returned; all 7 previously completed re-verified exactly |
| 2026-09-11 | not re-censused | not re-censused | Every leg of all 14 baskets returned; all 8 previously completed re-verified exactly — but the current bar censused 502 of 503, TXN absent |
| 2026-09-14 | not re-censused | not re-censused | Current bar back to 503 of 503, the hole did not recur — but the ledger itself failed to reproduce: three earlier bars returned one extra passer each |
The 2026-08-28 basket was recorded across four consecutive passes as “not trackable at all” — the base bar was missing for ADSK, SLB, RJF and VEEV — and then returned all five legs on a fresh download, completing at −3.20% (CRM +1.26, ADSK −16.40, SLB +0.31, RJF −0.60, VEEV −0.58).
The fourth instance is the one that settles the shape of this. One session after a census that returned 503 of 503 with zero missing bars, the very next download of the very same universe came back 502 of 503, with TXN missing. Nothing in the dataset changed between them except which download was being read.
Four instances is well past anecdote. A coverage census is a per-run measurement, not a property of the dataset — so any backtest built on one download of this provider is a measurement of that download. Anything depending on a lookback window should be recomputed rather than cached, and a clean census is evidence about one run and no more.
The biggest retraction on this page: the values move too
Every previous version of this page said the instability was in the presence or absence of bars and not in their values, on the grounds that all previously-completed baskets re-verified exactly against each fresh re-download. The 2026-09-14 pass withdraws that in its own words — the claim that prior completions re-verify “to the digit” no longer holds — and it is the most consequential correction this page has made.
The mechanism is this trial’s own August finding followed one step further: the provider revises volume after the close. The same bar, re-read, is not the same bar.
| Bar, re-read three times | First read | Second read | Third read |
|---|---|---|---|
| INTU 2026-08-25, relative volume | 1.80 | 1.91 | 1.95 |
| INTU 2026-08-25, volume | 7,062,400 | — | 7,200,900 |
| MRNA 2026-08-25, volume | 49,104,300 | — | 49,225,700 |
That third INTU reading was taken sixteen days after the close it describes. A screen whose gate is a ratio of a revisable number therefore cannot be reproduced from the provider alone — and on this pass it wasn’t: three earlier bars each returned one extra passer, and on two of them the extra name landed inside the tracked top five and changed a published return.
The fix is not a better gate. It is to snapshot the bars used at decision time and compute forward returns from the snapshot, so the record is of what was actually visible when the decision was made. Any backtest that re-downloads its universe at run time is measuring a moving target, and will not reconcile with itself later.
That closes an August claim too. With the first gap open, the trial’s SMA convention (average over available bars) returned 502 eligible names and 10 passes against 48 and 1 under a strict complete-20-bar rule. Healed, 501 of 502 eligible names sit on a full 20-bar window and both conventions return the same 10 names. The divergence was an artifact.
The screen went from 2 names to 16 in a single session
On the 2026-09-04 bar the preset passed 2 of 503 names — the smallest list of the trial by a factor of three, from a run that reached 35 a week earlier. The second retraction on this page is what we made of that. An earlier version treated it as a collapse worth a section heading. On the very next session it went back to 16, so the collapse did not persist even one bar.
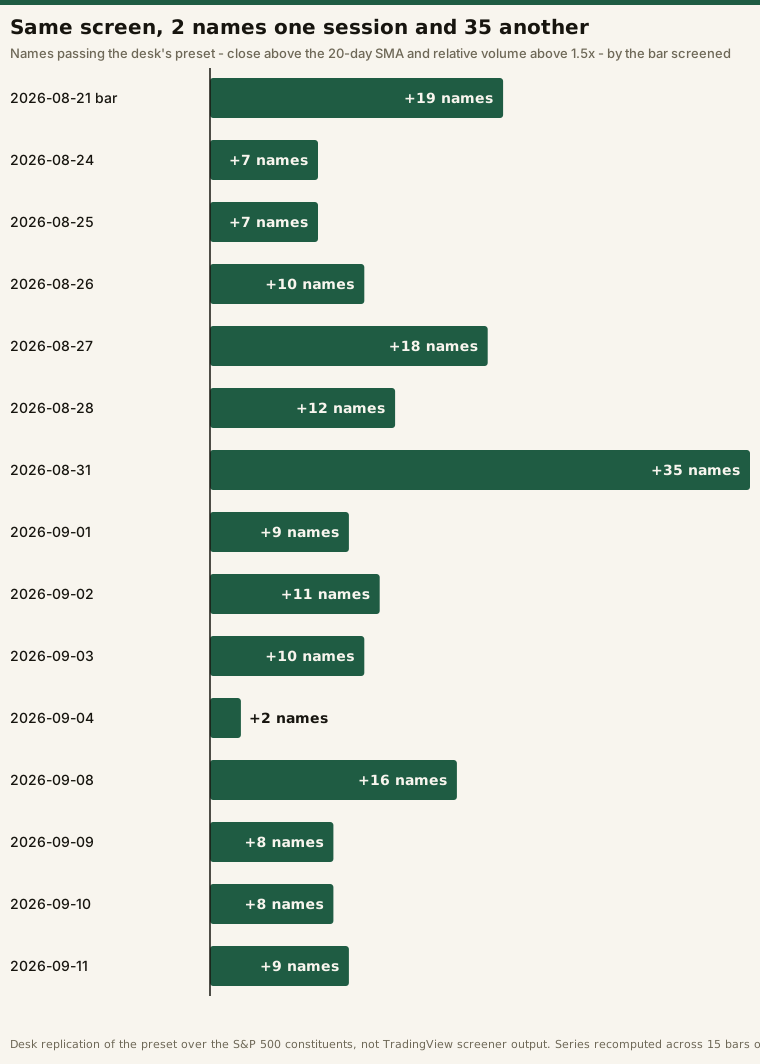
Which leg moved is the finding, and a fifth bar has just complicated it. For four bars the swings sat squarely in the volume leg:
| Leg of the screen | 2026-09-04 bar | 2026-09-08 bar | 2026-09-09 bar | 2026-09-10 bar | 2026-09-11 bar |
|---|---|---|---|---|---|
| Names over the 1.5x relative-volume gate | 16 (3.18%) | 72 (14.31%) | 48 (9.54%) | 54 (10.76%) | 31 (6.16%) |
| Of those, share also above the 20-day SMA | 12.5% | 22.2% | 16.7% (8 of 48) | 14.8% (8 of 54) | 29.0% (9 of 31) |
| Cross-sectional median relative volume | 0.868x | 1.041x | 0.988x | 0.997x | 0.912x |
| Names passing the whole screen | 2 | 16 | 8 | 8 | 9 |
| Names dropped by the $2B market-cap gate | 0 | 0 | 0 | 0 | 0 |
| Constituents censused that bar | 503 | 503 | 503 | 502 | 503 |
For the first four bars a fixed relative-volume gate looked substantially like a bet on market-wide participation rather than on the names it returns: the same rule, unchanged, returned 2, then 16, then 8, then 8 names while the cross-sectional median relative volume went 0.868x → 1.041x → 0.988x → 0.997x, and the price leg moved far less (12.5% → 22.2% → 16.7% → 14.8%).
The fifth bar breaks that tracking, and in the informative direction. On 2026-09-11 participation fell — median relative volume 0.912x, only 31 names over the gate against 54 — and yet the screen returned more names, 9 against 8, because the price leg nearly doubled: 29.0% of gate-clearers also sat above their 20-day SMA, against 14.8% the bar before. Breadth explains it: 124 of 503 constituents closed above their own 20-day SMA on the 2026-09-11 bar, against 87 of 502 one bar earlier. The pass count is a product of two moving terms, and reading it as a participation proxy works only while one of them holds still.
Worth sitting next to that: on the 2026-09-10 bar only 87 of 502 constituents were above their own 20-day SMA, down from 105 of 503 the session before that, while the desk’s index-level SMA rule still read Bull on both SPY and QQQ — then breadth jumped to 124 of 503 the very next bar. An index above its average does not mean its members are, and the member-level reading moved twice, hard, in two sessions while the index-level read did not move at all.
The $2B gate, meanwhile, dropped 0 names for an eleventh straight session — the smallest passer on the 2026-09-11 bar was SWKS at $13.3B, more than six times the floor — so on this universe it has never once bound. (Our own log’s summary line for the 9 September session names BG at $23.7B as the smallest passer, while the passer list immediately beside it holds CHRW at $17.6B. The summary line is wrong; the conclusion — nothing came near a $2B floor — is unaffected, and we are reporting the discrepancy rather than quietly picking one.)
The top five by relative volume on the 2026-09-11 bar — the names that became that day’s tracked basket:
| Rank | Name | Close vs 20-day SMA | Rel. volume | Market cap | Session move |
|---|---|---|---|---|---|
| 1 | ORCL | 150.28 vs 149.378 (+0.60%) | 3.315 | $432.9B | −1.74% |
| 2 | KR | 58.49 vs 57.508 (+1.71%) | 2.104 | $34.9B | +2.70% |
| 3 | JCI | 146.01 vs 144.168 (+1.28%) | 2.079 | $88.4B | +2.24% |
| 4 | SWKS | 88.35 vs 70.829 (+24.74%) | 1.870 | $13.3B | +5.14% |
| 5 | HPE | 62.09 vs 54.646 (+13.62%) | 1.710 | $82.4B | +12.44% |
Relative volume is the bar’s volume over the mean of the prior 20 bars; market caps are a live snapshot read at run time, so they gate size rather than measure it point-in-time.
Two of the previous session’s five tracked names, ORCL and SWKS, passed again on this bar. The pass does not publish the full prior-session passer list, so we are not putting a carry-over rate on it.
The preset’s specification problem now has its cleanest illustration at the very top of the list, two sessions running. The screen carries no direction filter, and on the 2026-09-11 bar its top-ranked candidate was ORCL, 3.315 relative volume, and down −1.74% on the day it qualified — the same name that topped the 2026-09-10 list while closing −5.38%. A gate that reads “above the 20-day SMA plus heavy volume” encodes nothing about direction: a heavy-volume decline that has not yet cut through the average passes the screen in exactly the same way a breakout does, and on both bars it passed first. “Above the 20-day SMA” is a statement about an average, not about the day — the failure mode described in what a stock screener actually does.
How badly that bites swings session to session rather than sitting at a level: the share of passers that closed lower on the day they qualified runs 41% / 33% / 0% / 10% / 50% / 6.25% / 50% / 12.5% / 11.1% across the measured bars, ending at 1 of 9 on the 09-11 bar. The direction problem is a property of the session as much as of the preset — and on the last two bars the single faller was the screen’s top-ranked name both times.
One construction note, and the reason interims are kept off the metric line. Four baskets were still in flight at this pass:
| Basket start bar | Legs | Sessions held | Interim — not the metric |
|---|---|---|---|
| 2026-09-04 | TSLA/BEN | 4 of 5 | +0.05% — two names only, cannot be pooled with the five-name baskets |
| 2026-09-08 | QCOM/WRB/TKO/BG/COR | 3 of 5 | −0.00% |
| 2026-09-09 | META/WRB/CHRW/HCA/SBAC | 2 of 5 | +0.24% |
| 2026-09-10 | ORCL/ELV/WRB/SWKS/AAPL | 1 of 5 | +1.09% |
A fifth entered on 2026-09-11: ORCL/KR/JCI/SWKS/HPE. None of those five numbers is a result, and the 2026-09-03 basket is the reason — it read −7.62% at four sessions and closed at −4.87%.
Alerts: the session the rig lost, and why it is the most useful one
The rig has recorded 3,898 timestamped records across eleven sessions, one alert per minute per regular session (13:30:00Z–19:59:00Z, 390 expected slots). Ten of those sessions produced a latency distribution. The eleventh produced one record, and it is still the one worth reading first:
| Session | Alert records | Median transit | p95 | Max | Minute slots covered | Share firing on :00 |
|---|---|---|---|---|---|---|
| 2026-08-27 | 391 | 1.63s | 3.92s | 5.86s | 390 of 390 | 65.2% |
| 2026-08-28 | 391 | 1.81s | 4.24s | 24.45s | not re-reconciled | not measured |
| 2026-08-31 | 390 | 1.57s | 3.68s | 8.47s | 390 of 390 | 65.9% |
| 2026-09-01 | 386 | 1.59s | 3.83s | 10.07s | 386 of 390 — 18:44Z–18:47Z | 65.5% |
| 2026-09-02 | 389 | 1.74s | 4.28s | 8.52s | 389 of 390 — 13:44Z, isolated | 60.4% |
| 2026-09-03 | 390 | 1.685s | 3.93s | 11.68s | 390 of 390 | 70.0% |
| 2026-09-04 | 390 | 2.065s | 5.43s | 16.93s | 390 of 390 | 63.3% |
| 2026-09-08 | 390 | 1.955s | 4.61s | 16.22s | 390 of 390 | not measured |
| 2026-09-09 | 390 | 1.935s | 6.14s | 30.13s | 390 of 390 | not measured |
| 2026-09-10 | 1 | 1.02s | 1.02s | 1.02s | 1 of 390 — 0.26% | not measured |
| 2026-09-11 | 390 | 2.07s | 6.47s | 26.08s | 390 of 390 | not measured |
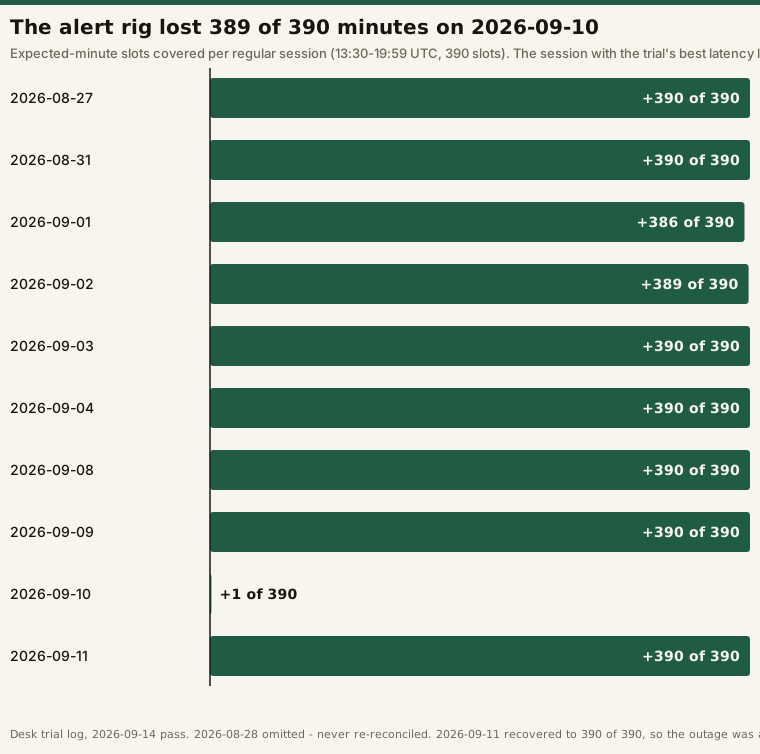
That last row has the best latency line in the entire trial and it is worthless, which is the finding. On 10 September the rig captured a single record: one SPY alert fired at 14:24:42 UTC, 54 minutes into the session, delivered in 1.02s. Median 1.02s, p95 1.02s, max 1.02s — a clean sweep of every central and tail statistic this page reports, off one observation.
We checked it was real rather than a parsing failure before writing any of this down. An aws s3api list-objects-v2 call returns exactly one object under the 2026-09-10 date prefix against 390 under 2026-09-09, and the single record is well-formed with no test flag, so nothing was silently filtered out on the way in.
What we are not claiming is what caused it. An alert that stopped firing inside TradingView, an alert that was disarmed, a webhook endpoint that stopped accepting, and a receiver that stopped writing all produce an identical one-record bucket from outside. Separating them needs an in-platform observation this trial has not made, and no owner note exists for the date. So this is not a reliability finding about TradingView, and we are not filing it as one.
The publishable lesson is about trial design, and it generalizes past this vendor: a latency benchmark that reports only percentiles cannot tell a fast session from an empty one. Every percentile on this page is published beside its denominator for exactly that reason — and if the coverage column had not been there, 10 September would have entered the record as the fastest session of the trial. The three fully reconciled sessions are read against the 100-300ms figures the popular guides publish in our alert-delay trial.
It was one session, and it did not come back. The next session, 11 September, captured 390 of 390 minutes — so the rig had not broken, and the escalation the previous pass raised is closed. But re-running 10 September on this pass returns the identical 1 alerts, median 1.02s line: no backfill, no replay, no late arrivals. A missed observation in a latency trial is not a delayed observation; it is a permanent hole in the denominator. That is why the coverage column is a published column rather than a note.
The middle and the tail move independently, and the fourth reconciled session is the clearest case yet. Across the four fully reconciled sessions the median crept up — 1.685s → 1.955s → 1.935s → 2.07s — while the p95 went 3.93s → 4.61s → 6.14s → 6.47s and the max went 11.68s → 16.22s → 30.13s → 26.08s. On 11 September the median was the slowest of the four and the max was lower than the session before it: the centre and the tail moved in opposite directions on the same session, and a single “alert latency” number would have concealed both.
The shape of that session in full, from its 390 per-alert lines: min 0.35s, p25 1.50s, median 2.07s, p75 2.90s, p90 4.32s, p95 6.47s, p99 14.61s, max 26.08s, mean 2.656s — with 31 of 390 (7.9%) over five seconds and 8 of 390 (2.1%) over ten. Four sessions is not a trend and we are not calling it one; the lost session adds nothing either way, because a single record has no percentile structure to compare.
A discrepancy in our own log, reported rather than resolved. The 9 September pass calls 8 September “the second 100%-complete session of the trial (the first was 2026-09-03)”, and the 10 September pass calls 9 September the third. The 8 September pass, earlier in the same file, records 4 September as 390 alerts across 390 distinct fired minutes with zero gaps and zero duplicates — equally complete — and 27 August and 31 August both read 390 of 390 as well. Those passes counted “complete” differently and we have not established which definition each used. We are not picking one: the per-session numbers above are what the log supports, and the summary sentence is the part that does not reconcile.
What we are not claiming: whether TradingView failed to fire the four consecutive minutes missing on 1 September, or our own rig failed to record them. Telling those apart needs the vendor’s alert log — an in-platform observation this trial has not yet made.
The slowest session, and the bug in what “slowest” meant
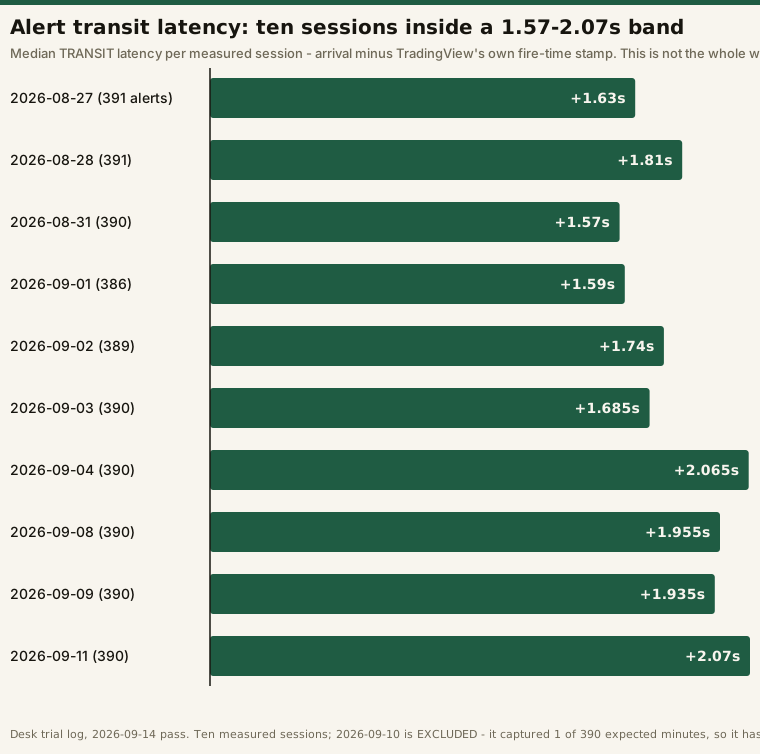
This page no longer names a slowest session, and the reason is a rounding gap. 11 September’s transit median of 2.07s and 4 September’s 2.065s sit 0.005s apart — smaller than the rounding difference this page documents two paragraphs below, where the same 4 September session recomputes to 2.067s depending on whether each latency is rounded before the median is taken. Two figures that close are not a ranking, and we are not publishing one.
The tail is a different story and is not close at all: 9 September’s max of 30.13s is the largest single delivery of the trial, ahead of 11 September’s 26.08s, 28 August’s 24.45s and 4 September’s 16.93s — on a session whose median (1.935s) is below both of the leaders on central statistics. A slow session and a session with one slow alert are different failures that a single “average latency” number would merge.
Then the 8 September pass found that the statistic on that chart is not the number a reader would assume it is. trial_latency.py computes arrival − fired_at, where fired_at is TradingView’s own {{timenow}} stamp — so any delay already baked into the vendor’s timestamp before it left is invisible to the metric. It measures transit, not the wait. Because the rig fires one alert per minute on the minute, the same session can be re-measured from the minute boundary, which captures the whole interval:
| 2026-09-04, 390 alerts | Transit (arrival − fired_at) |
Total, from the minute boundary |
|---|---|---|
| Median | 2.067s | 2.664s |
| p95 | 5.43s | 7.90s |
| Max | 16.93s | 24.93s |
Mean from the boundary is 3.290s. The transit median recomputes to 2.067s against the 2.065s published earlier — a rounding difference, not a data one: the script rounds each latency to two decimals before taking the median and this pass did not.
This is our measurement definition being wrong, not a vendor defect — the second correction on this page. Six of the nine sessions sit inside a 1.57–1.81s transit band, so 4 September is about 14% above the top of it on that basis; but no figure here should be read as the delay a user waits, because only the boundary column even attempts to measure that, and only for one session. Every latency figure in this trial is SPY-only: the second alert has not fired since 31 August.
The third retraction, and the part of it a third session gave back
The trial’s most-quoted finding is that alerts fired on round minutes arrive measurably more slowly than the rest. On 8 September that effect looked like something better than a single penalty: a monotonic hierarchy, with the delay ratio climbing as the boundary got coarser, all the way to the top of the hour. It was tidy, it was the most quotable number the rig had produced, and on 3 September — the trial’s other fully reconciled session at the time — the identical computation returned an essentially flat profile, with the top-of-hour bucket the lowest ratio of the five rather than the highest. We withdrew the hierarchy.
A third fully reconciled session, 9 September, then gave part of it back. Here are all three, on-boundary median over off-boundary median, computed identically:
| Boundary tested | Alerts in the bucket, per session | 2026-09-03 | 2026-09-08 | 2026-09-09 |
|---|---|---|---|---|
| Every 5th minute | 78 | 1.70x | 1.90x | 2.01x |
| Every 10th minute | 39 | 1.81x | 1.94x | 2.02x |
| Every 15th minute | 26 | 1.82x | 2.22x | 4.34x |
| Every 30th minute | 13 | 1.84x | 2.62x | 7.59x |
| Top of the hour | 6 | 1.68x | 4.50x | 10.44x |
Two different things are going on in that table, and separating them is the whole point.
What we stand behind: the 5-minute boundary penalty. Three sessions, 78 on-boundary observations each, in a tight range of 1.70x to 2.01x. That is a three-session result and we publish it as one.
The significance test behind it was run on one of those three sessions, not on all three, and the distinction is worth spelling out because it is easy to overstate. On 2026-09-03 the on-boundary median of 2.570s (n=78) against 1.515s (n=312) off-boundary — a gap of 1.055s, ratio 1.70x — was put through a 20,000-shuffle permutation test (seed 12345, one-sided) and returned 0 of 20,000 shuffles at or above the observed gap, p < 0.00005. The 8 and 9 September passes recomputed the ratio and nothing else: no shuffle test, no p-value. So what has replicated three times is the ratio, and what carries a significance test is one session. Both are true and they are not the same claim.
What stays withdrawn: every multiplier coarser than that. The top-of-hour penalty reads 1.68x, 4.50x and 10.44x on the three sessions — a factor of six between the smallest and the largest. There is no number to quote there and we are not quoting one. The direction has now held on all three sessions (the top-of-hour median exceeded the off-boundary median every time), and 9 September was not a repeat of the two-outlier artifact 8 September was: all 6 of 6 top-of-hour alerts exceeded 5s that session (30.13 / 22.87 / 20.68 / 19.39 / 7.08 / 19.61), against 4 of 6 on 8 September. So the sign is a finding and the size is not.
The reason the coarse rows behave that way is bucket size: a six-observation median moves a long way on two extreme values, and a 78-observation one does not. Its cause is still undetermined either way — one desk’s rig on one webhook path cannot separate vendor-side contention from its own plumbing, so none of this is a statement about TradingView. The distribution, the controls and the permutation test live in our write-up of running an autonomous trading agent.
The lesson generalizes past this trial: a bucket of six observations will produce a clean monotonic trend that the next session erases, and then a third session that looks like vindication. Direction and magnitude replicate at different rates, and a finding that reports only one of them is telling you half of what it knows.
The phantom missing minutes
The most useful thing this track has produced is a bug in the desk’s own reconciliation code. Alerts do not all fire on the whole second — the :00 share runs 60.4% to 70.0%, and on 3 September offsets spanned 0 to 35 seconds. A grid built in whole-minute steps and differenced against raw fire timestamps invents gaps:
# Illustrative: the reconciliation bug, and the fix, on the 2026-09-03 session.
grid = minute_slots("13:30:00Z", "19:59:00Z")   # 390 whole-minute slots

# WRONG - joins on the exact timestamp. Only 273 of 390 records fire on :00,
# so every jittered alert manufactures a missing minute.
missing = [m for m in grid if m not in set(fired_at)]            # -> 117

# RIGHT - truncate seconds on both sides before differencing.
covered = {t.replace(second=0, microsecond=0) for t in fired_at}
missing = [m for m in grid if m not in covered]                  # -> 0
On a session that was in fact perfect, the buggy join reports 117 missing minutes. A reconciliation that joins on an exact timestamp silently manufactures missing data whenever the source has sub-minute jitter, and its worst output lands on its cleanest input. On 4 September the vendor’s stamp landed off the whole second for 143 of 390 alerts, 36.7%, mostly by one or two seconds — enough jitter to break the naive join outright.
What the paywall actually gates, read today
Every figure in this section was re-read off tradingview.com/pricing and the /gopro/ comparison grid on 15 September 2026. Vendor pages change; check them yourself before acting on any row.
| Basic (free) | Essential | Plus | Premium | Ultimate | |
|---|---|---|---|---|---|
| Displayed price, billed annually | $0 | $12.95/mo | $29.95/mo | $59.95/mo | $199.95/mo |
| Active price alerts | 3 | 20 | 100 | 400 | 1,000 |
| Charts per tab | 1 | 2 | 4 | 8 | 16 |
| Indicators per chart | 2 | 5 | 10 | 25 | 50 |
| Bars of history | 5K | 10K | 10K | 20K | 40K |
Checkmark rows — screeners, custom time intervals — are deliberately absent from that table. The reason is the next section.
Every price and every numeric limit above reproduced exactly on today’s read, on both pages, unchanged from every previous read this trial has made. Prices carry the vendor’s own “billed annually” label — that basis is now stated on the page itself, so a monthly-billing figure is a different number and is not quoted here.
The checkmark rows are a different story, and the third correction on this page has become a standing refusal rather than a correction. An early version said our 65-minute chart interval required Essential or above. A later read of the plan-comparison grid showed “Custom time intervals” checked on every tier including free Basic, so we withdrew the claim. On 11 September both first-party reads showed it unchecked for Basic — the opposite. On 14 September the two pages disagreed with each other, minutes apart. Today both were read again, and they agree once more:
| Cell, for the free Basic tier | 11 Sep 2026 | 14 Sep 2026 | 15 Sep 2026 |
|---|---|---|---|
| “Custom time intervals” on tradingview.com/pricing | blank | checked | blank |
| “Custom time intervals” on tradingview.com/gopro | blank | blank | blank |
| “Stock, ETF, DEX, crypto screeners” on tradingview.com/pricing | blank | checked | blank |
| “Stock, ETF, DEX, crypto screeners” on tradingview.com/gopro | blank | blank | blank |
| Every price and every numeric limit, both pages | reproduced exactly | reproduced exactly | reproduced exactly |
Three consecutive dates, three readings, and the cells have not once been stable enough to quote — while the prices and the numeric limits beside them have reproduced to the cent and the unit every single time. Today’s agreement is not a resolution: it is the second of three dates on which these cells read blank, with a contradictory day in the middle that we have no way to explain from outside. Our standing position is unchanged: we make no claim about which tier custom time intervals or screeners start at. A cell we cannot read the same way twice running is not a feature we will assert, and it is the concrete reason this page separates numbers from checkmarks rather than tabling them together. Open the grid yourself. We are on Essential’s free trial, and if we keep the subscription past it we will say so.
There is a free tier if you want to look at the charts first: TradingView. We are not recommending a paid tier — twenty-three days of a 30-day protocol with two tracks empty, and its largest finding just retracted, is not a basis for one. For cheaper or narrower swaps, see TradingView alternatives. TradingView’s separate beta AI extension is covered in AI Chart Copilot.
Frequently asked questions
Is TradingView worth it?
Not answerable yet — our answer arrives when the protocol closes on 22 September 2026 and all four tracks have data. Two of the four still hold no data at all, a third permanently lost a session on 10 September, and the fourth could not reproduce its own ledger on 14 September. Any page answering the question today from a feature list is guessing.
Did these numbers come from TradingView’s own screener?
No. They come from a public-data replication of the same preset across the S&P 500, run by this desk. The in-platform screener comparison is a track with no data yet.
How has the desk’s momentum screen performed?
We are not answering that with a number, deliberately, and as of the 2026-09-14 pass there are two candidate numbers rather than one. Ten baskets have completed. The ledger as recorded holds nine of them at a median five-session equal-weight paper return of −1.20%, mean −1.16%, 6 of 9 negative; an independent reconstruction run on 14 September returns median −1.65%, mean −1.67%, 7 of 10 negative, because the provider revises volume after the close and two earlier baskets re-screen to different fifth legs. Neither series is final. Beyond that, ten observations cannot characterize a screen at all: on the recorded basis the mean of the first five was +0.004%, of the first seven −1.12%, and of all nine −1.16%, while the median ran +0.60% → −0.47% → −1.20%. The movement between those figures is a statement about sample size, not about the preset. The rule behind them is fixed and stated above: from the start-date close, top five by relative volume among S&P 500 names above their 20-day SMA with relative volume over 1.5x and a $2B cap floor, equal-weighted, held five sessions.
Why did the screen return only two names on 4 September?
Because both conditions had to hold at once and the volume condition failed almost everywhere: only 16 S&P 500 names cleared the 1.5x relative-volume gate, and just two of those also closed above their 20-day SMA. Four sessions later the same unchanged rule returned 16 names, then 8, then 8 again, tracking a cross-sectional median relative volume that moved 0.868x → 1.041x → 0.988x → 0.997x. On the fifth bar that tracking broke: participation fell to 0.912x and 31 gate-clearers, yet the screen returned 9 names, because breadth jumped from 87 of 502 constituents above their 20-day SMA to 124 of 503.
Did TradingView miss four alerts on 1 September?
Unknown, deliberately. The rig received 386 of 390 expected minutes with four consecutive missing; blaming the platform rather than our own receiver would require the vendor’s alert log, which we have not read.
Why does this page report one alert session as “1 of 390”?
Because on 10 September 2026 the rig captured a single record where 390 were expected — 0.26% coverage — and that session’s latency line (median, p95 and max all 1.02s) is the best in the trial precisely because it is empty. We report the denominator beside every percentile for that reason. The next session captured 390 of 390, so the rig was not broken; re-running 10 September on a later pass returns the same single record, so the data never arrived late either — a missed observation is a permanent hole, not a delayed one. We are not attributing the gap: a vendor-side alert that stopped firing, a disarmed alert, a dead webhook endpoint and a receiver that stopped writing are indistinguishable from the outside without an in-platform observation this trial has not made.
How long does a TradingView alert take to arrive?
We are not answering that yet, and the reason is instructive. Our rig measures arrival minus TradingView’s own fire-time stamp, which is transit only — it cannot see delay incurred before the stamp was written. On the one session re-measured from the minute boundary, the median roughly doubles, from 2.067s to 2.664s. One session on one desk’s webhook path is not a platform characteristic.
Why has this page changed its findings five times?
Because the desk’s own later passes and its own fact-check refuted them, and a trial that never overturns itself is not being run. The first was a claim that most completed baskets reversed against their late interims — it held only while a data gap kept interims uncomputable. The second was labelling the alert-latency medians as delivery delay when they measure transit. The third was a clean monotonic latency hierarchy across clock boundaries that a second session flattened, traced to buckets holding six observations — and a third session then partly reinstated it, so the direction is now published and the magnitude is still withheld. The fourth was attaching a one-session permutation test to a three-session ratio: the 5-minute boundary penalty replicates across three sessions, but only one of them was ever shuffled. The fifth is the largest and is in this revision — that the provider’s instability was confined to whether bars were present rather than what they contained. It is not: volume is revised after the close, the same bar has read three different relative volumes sixteen days apart, and two already-published basket returns changed as a result. Separately, one item is unresolved rather than corrected — which plan tier custom chart intervals and screeners start at, where the vendor’s two own pages have now returned three different combinations on three consecutive dates. All of this came from our own records, not from the vendor.
Is this a paid or sponsored review?
No. TradingView has not reviewed, seen or paid for this page; the link above is an affiliate link and the disclosure below says what that means.
Disclosure: this page contains an affiliate link. If you subscribe through it this site may earn a commission at no additional cost to you. No vendor reviewed this page or paid for placement, and the trial subscription was bought by this desk.
This is educational content, not financial advice. We have not completed our evaluation; nothing here is a recommendation to buy any product or to trade any security.