Running an Autonomous Trading Agent: The Operational Reality
An autonomous trading agent fails on infrastructure long before strategy. Clocks, silent overwrites, phantom data and delivery latency, from our own logs.
Running an autonomous trading agent is an operations problem wearing a trading problem’s clothes. In our own instrumented rigs the failure modes that actually appeared were a timezone mismatch in a filename, a measurement leg that silently never recorded, a data field that populated on one run and not the next, and a delivery delay clustered on exactly the minutes everyone schedules — no strategy problems, all capable of invalidating a result.
An agent is a measuring instrument pointed at a market: before you trust a reading, establish that the instrument works. Everything below is calibration. No positions, signals, account values or trading results appear on this page.
Key findings from our own rigs
| Finding | Measurement | Status |
|---|---|---|
| Alert delivery is slowest on round minutes | Median 2.89s on minute % 5 == 0 vs 1.466s on every other minute (n=391, 2026-08-27) |
Reproduced on a second independent session |
| Headline delivery latency | Median 1.63s, p95 3.92s, max 5.86s across 391 alerts in one session | Single-session figures, restated per session |
| Silent overwrite in our own probe | Output file named by UTC date, opened with a truncating write; one collision on 2026-08-26 | Dormant, not fixed — precondition is any run after 20:00 ET |
| Post-close volume revision | One name’s relative volume for a finished session moved 1.80 → 1.91 → 1.95 over 34 hours | Mechanism confirmed on a second name, same direction |
| Order writes slower than reads | 2 sessions for, 1 against (see table below) | No pattern claimed |
The rest of this page is how each was found, and what it changed about the method.
Guardrail zero: bound the blast radius before the first run
Our probe runs against the paper endpoint only, written into the trial method before any code ran rather than added after something went wrong. The ordering matters more than the rule: a guardrail added after an incident is a patch; one specified before the first run survives the moment you are tired and want to see the thing work. Same logic for credential scope — separate read and trade keys, no withdrawal permission — and for kill conditions, which must be thresholds checkable automatically rather than an intention to keep an eye on it. When that credential reaches the broker through an MCP server rather than your own code, the scope question has its own shape — what an AI agent can and can’t touch, and one first-party server’s answer is a ring-fenced account and a nine-day token. And when the code holding that credential was generated by a model in the first place, the same guardrails are the step the viral playbook never writes down. None of this is delegated upward, either: the regulator’s 2026 report on AI agents binds your broker, not you.
The latency a backtest cannot contain
A backtest acts at a bar. An agent acts when a message arrives. We instrumented that gap end to end and the first full session produced 391 records on 2026-08-27. Latency here is arrival time at our endpoint minus the fired_at field the platform stamps on the payload; grouping those records by minute-of-hour is the whole finding:
# Illustrative — the grouping that produced the table below.
import statistics as st
rows = load_alerts("2026-08-27")            # 391 non-test webhook records
lat  = lambda r: (r["arrival_ms"] / 1000) - parse_ts(r["payload"]["fired_at"])

round_min = [lat(r) for r in rows if minute_of(r) % 5 == 0]   # n = 79
other     = [lat(r) for r in rows if minute_of(r) % 5 != 0]   # n = 312
st.median(round_min), st.median(other) # -> 2.89, 1.466| Cut (2026-08-27, n=391) | Median on the boundary | Median, all other minutes | Gap |
|---|---|---|---|
| All messages | 1.63s (p95 3.92s, max 5.86s) | — | — |
| Minute divisible by 5 | 2.89s (n=79) | 1.466s | 1.42s |
| Minute divisible by 10 | 3.00s | 1.51s | 1.49s |
| Minute divisible by 30 | 3.20s | 1.59s | 1.61s |
The rounder the minute, the slower the delivery. That gap is not eyeballed: a permutation test on the difference of medians — 20,000 shuffles, seed 12345, one-sided — returned p < 0.00005. Zero of 20,000 random splits reproduced a gap that large.
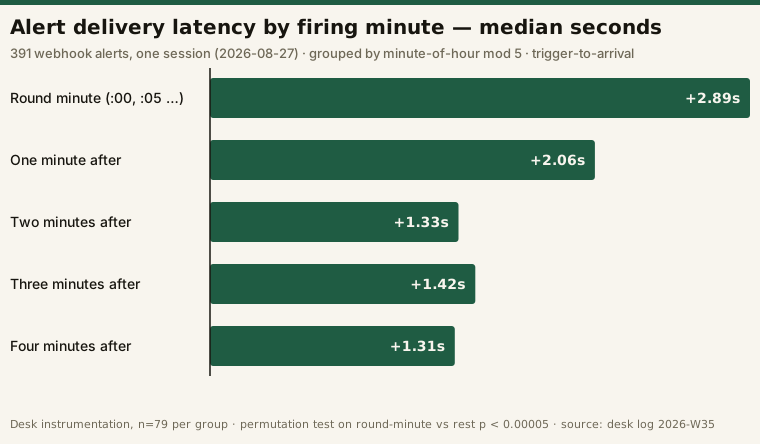
The decay across the two minutes after the boundary is the diagnostic part: a fixed per-message cost would be flat, while a draining queue looks exactly like 2.89 → 2.06 → 1.33, then flat. Stated plainly, the most popular moments to schedule an agent are the slowest moments to hear from it — and the median conceals it, because the 15 messages over four seconds concentrate on precisely those boundaries. The delivery times these boundaries are measured against are reported per session in our alert-delay trial.
It held on a second session, same rig and same definitions:
| 2026-08-27 | 2026-08-28 | |
|---|---|---|
| n (non-test records) | 391 | 391 |
| Median latency | 1.63s | 1.81s |
| Round-minute median | 2.89s (n=79) | 2.72s (n=79) |
| All other minutes | 1.466s | 1.699s |
| Gap | 1.42s | 1.02s |
| Permutation test (20,000 shuffles, one-sided) | p < 0.00005 | p < 0.00005 |
Two independent sessions, same direction, same shape, same significance. Caveats: fired_at is the platform’s own whole-second timestamp, so each measurement carries roughly a second of quantisation plus internal detection delay; this is an end-to-end path number, not a single-hop one; and the second session held a single 24.45s outlier, which supports nothing on its own.
The clock is infrastructure, and it will bite you in a filename
Our probe is scheduled by cron at 30 10 * * 1-5, and the environment is re-verified each session — timezone America/New_York, clock NTP-synchronised, so that cron minute maps to 10:30 ET. Verifying the mapping rather than assuming it is a two-command check that removes a whole class of silent failure.
The defect we found was subtler. The probe named its output file by UTC date while the schedule ran on Eastern time, and opened that file in write mode. Individually harmless; together they meant any run after 20:00 ET wrote to the next market day’s filename and truncated it, silently.
That collision fired on 2026-08-26. A seed run at 22:13 ET the evening before is 02:13 UTC the next day, so it wrote 2026-08-26.json; the scheduled 10:30 ET probe that morning is 14:30 UTC on the same UTC date, so it wrote the same filename and truncated it. We recovered the seed run from git history — but the directory showed one file where two runs had happened, with nothing indicating a second run existed.
On the following market days no collision occurred, and the reason is not the reassuring one: the runs fell on different UTC dates. Our most recent pass found the defect dormant, not fixed — the probe still names output by UTC date and still opens it with a truncating write. Clean days are evidence nobody ran the probe late in the evening, not evidence the bug is gone.
The durable lesson is what the incident did to verification. A correctly named file stopped being sufficient evidence that a run happened; every pass since checks the embedded run timestamp and the file’s modification time instead. A silent overwrite bug does not just destroy data — it invalidates your monitoring.
Your instrument lies before your strategy does
Two smaller findings from the same rig, both of the form “the code does not do what its own documentation says.” The method says the probe’s market order is immediately flattened and the flatten timed to fill; enumerating the recorded keys — submit_ms, filled, fill_wait_ms, fill_price, ref_last, slippage_bps, flatten_req_ms — shows only the flatten request time. That measurement had been described, believed, and never taken. Separately, the recorded accepted status read "new" on two consecutive sessions where an earlier run recorded "accepted" — both ordinary broker states, but an agent branching on that string branches differently across those runs.
The habit that catches both: periodically enumerate what your rig recorded against what your method claims it records. The two drift apart quietly, and only in that direction.
Data landmines: fields that come and go, numbers that keep moving
Upstream data can be wrong in ways no error surfaces: our migration work found a source that back-pads pre-inception history with a flat constant — 117 fabricated sessions in front of one real series — one of six defects worked through in backtesting mistakes only real market data reveals.
The intermittent version is worse than the missing one. Replicating a momentum screen across sessions, we hit names whose market-cap field returned nothing on one run and a real number on the next, so the size gate silently deleted names for missing metadata rather than for size (full sequence here). A filter backed by an intermittently populated field is not a filter — it is a sampler correlated with your vendor’s cache state, and an agent inherits it at the first stage of the chain, where the screener → chart → journal handoffs either carry the run timestamp forward or lose it.
A quieter version is measurable. Re-reading the same completed session’s volume three times, one name’s relative volume moved on an unchanged 20-session denominator:
| Read (UTC) | Session volume | Prior-20 mean | Relative volume |
|---|---|---|---|
| 2026-08-26 02:30 | not recorded | not recorded | 1.80 |
| 2026-08-26 12:00 | 7,062,400 | 3,697,480 | 1.91 |
| 2026-08-27 12:00 | 7,200,900 | 3,697,480 | 1.95 |
The denominator is identical to the digit; the numerator rose. Closing prices reproduced exactly, so the revision is in the reported session volume itself — roughly +8% over 34 hours after the close, and still moving on the third read. A second name behaved the same way; four others reproduced exactly. Same bar, same code, different answer.
The rule we now run on, because “a threshold has a settling period” is useless as an anecdote: this desk does not treat a volume-derived field for a completed session as settled until at least 48 hours after that close, and any name within 10% of a screen threshold — a relative volume between 1.35 and 1.65 against a 1.5 gate — is re-read at the next scheduled pass before it counts. Screens record their run timestamp, not just the bar date.
The n=2 problem: most findings do not survive their second session
This is the habit that separates an instrumented agent from a superstitious one. Two proposed findings, tracked across three sessions:
| Proposed finding | 2026-08-26 | 2026-08-27 | 2026-08-28 | Verdict |
|---|---|---|---|---|
| “The first API call is always slowest” | Proposed — first sample slowest on all 3 endpoints | Inverted — slowest was the second sample on 2 of 3 | Inverted again — slowest was the fifth sample | Struck. Unsupported; not carried forward |
| “Order writes are slower than reads” | 73.5 / 75.0 ms vs 76.9 ms pooled read — not slower | 110.9 / 104.4 ms vs 74.4 ms — clearly slower | 94.7 / 83.0 ms vs 79.3 ms — mildly slower | Held in suspension. 2 for, 1 against; no pattern claimed |
The first was struck the moment it failed, and recorded as struck, so nobody downstream picks up the earlier version. The second keeps almost working — exactly the shape of a finding that gets believed on insufficient evidence — so it carries a stated resolution condition, the same way our tool trial protocol names roughly 100 trades as the floor for a strategy result: we will not characterise order-write latency before the trial’s full 30 scheduled sessions, and will claim a direction only if the write-minus-read gap has the same sign in at least 24 of those 30. Three sessions spanning −3.4 ms to +36.5 ms is not a measurement; it is the first three points of one.
Writing the falsification condition down before the next run, and honouring it, is the only mechanism we have found that reliably removes bad beliefs. Each pass also writes the next pass’s escalation condition explicitly, and the next pass records the verdict either way — which converts “check the logs” into a decidable test.
It cuts both ways, and that is the point. The same dataset that produced the round-minute effect also produced a second pattern — latency falling monotonically across the session — flagged for re-test rather than published. It did not hold: the next session’s hourly medians were not monotonic and the third hour was the slowest of the day. Two effects, same records, same day; one replicated and one did not.
A short checklist
- Bound the blast radius in the method, before the first run: paper endpoint, least-privilege credentials, no withdrawal permission.
- Verify the schedule’s timezone mapping rather than assuming it.
- Never let a filename be the evidence a run happened — check an embedded timestamp.
- Enumerate the fields your rig recorded against the fields your method claims.
- Assume any upstream field can be empty on one run and populated on the next; archive the run timestamp.
- Do not schedule anything time-critical on a round minute if a :02 will do.
- Write the falsification and escalation conditions before the run, not after.
Frequently asked questions
What breaks first when you automate a trading agent?
In our records, infrastructure — scheduling, file handling, upstream data availability — not strategy logic. The strategy is what you tested; the scheduler and data pipeline are what you assumed.
How long should an agent run in paper before going live?
Long enough for the rare failures to appear, which means a period fixed in advance rather than “until it looks fine.” Our trials run 30 calendar days with the metrics and end date written down before the start, per our tool-trial protocol. The number matters less than committing to it before you know the results.
Why are alerts slower on round minutes?
Round timestamps are where everyone’s alerts cluster, so the delivery queue is deepest there. Our two instrumented sessions measured medians of 2.89s and 2.72s on five-minute boundaries against 1.466s and 1.699s on all other minutes, with the delay decaying over the following two minutes — the signature of a draining queue rather than a fixed per-message cost.
Is monitoring an agent different from monitoring a normal service?
The uptime half is the same. The difference is that an agent can be healthy on every infrastructure metric and still record garbage — a truncated file, a leg that never measured, a filter deleting names for the wrong reason. Data-integrity checks must be separate from liveness checks, because a rig with a silent overwrite bug reports success right up until you read the file.
Why publish the bugs?
Because a result you cannot interrogate is one you take on trust — the same reason we publish our regime read method and our fill-assumption findings. An account with no defects in it is less complete, not more reliable.
This is educational content about software operations, not financial advice. No positions, signals, account values or trading results appear on this page; the measurements described come from paper-trading and market-data instrumentation, not live trading.