Options Backtest Fill Assumptions: Mid vs. Taker on Real NBBO Data
Options backtest fill assumptions can decide the verdict. On six years of real NBBO quotes, the same credit spread flips from profitable to losing.
An options backtest’s fill assumption — whether you price each leg at the mid or at the bid/ask — can matter more than the strategy it is testing. On our own research runs, one QQQ put-credit-spread configuration returned a profit factor of 1.18 when filled at the mid and 0.80 when filled as a taker, with no change to entries, exits, strikes or sizing: the same trades, the same six years of real quotes, opposite verdicts.
The part worth staying for is the follow-up. The obvious lesson — “be pessimistic, subtract a slippage haircut, move on” — turns out to be wrong, because when we ran the identical comparison on SPY the gap almost vanished. The size of the fill drag is itself instrument-specific, which means it is a variable you have to measure, not a constant you can budget for.
Everything below is a backtest simulation on historical data — not live results, not a prediction, not advice. Dollar figures from these runs are deliberately not published.
What “mid” and “taker” actually mean
The entire difference is one line in the backtest. For a credit spread you sell, the price you assume you receive per fill:
mid   = (bid + ask) / 2          # optimistic: someone meets you halfway
taker = bid                      # realistic floor: you cross the spread and hit the bid
# per spread, per side — entry AND exit each pay this toll
slippage_per_round_trip = 2 * (mid - taker)
On a $5-wide QQQ spread quoted 1.02 × 1.18, that’s $8 per side, $16 per round trip — before commissions. Multiply by 167 trades and the toll exceeds the strategy’s entire mid-fill profit.
The fill convention is one of several assumptions that decide a backtest’s verdict before the strategy logic runs; the data-side defects sit alongside it.
Every options backtest has to decide what price a trade would have gotten. There is no single answer, because an option does not have a price — it has a bid and an ask, and the distance between them is often a meaningful fraction of the trade’s entire edge.
The two conventions in these runs are the ends of the realistic range:
- Taker — sell at the bid, buy at the ask. You cross the spread on every leg, in both directions. This is the pessimistic assumption: what you get if you always take liquidity rather than post it.
- Mid — work the midpoint, minus a per-contract haircut. This is the assumption that you are a patient seller who usually gets filled somewhere better than the far side, but not for free.
Neither is “correct.” Taker is what a market order does; mid-minus-a-haircut is what a limit order does when it fills, and a backtest priced at the mid quietly assumes every one of them did. On a multi-leg spread you pay that gap four times — twice in, twice out.
The QQQ result: profitable becomes unprofitable
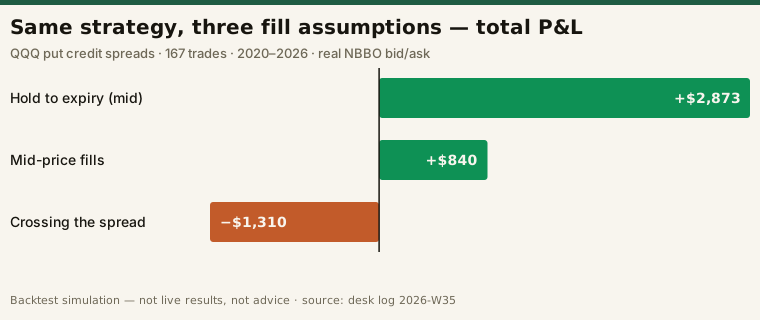
The desk ran put-credit spreads against end-of-day option bid/ask quotes pulled from a local ThetaData terminal — real NBBO, not a model — covering 2020 through 2026, with the underlying from Alpaca’s SIP daily bars and roughly weekly entries. Configurations are labelled by days to expiry and short-leg delta.
| QQQ config (2020–2026) | Trades | Win rate | Profit factor |
|---|---|---|---|
| 30–45 DTE, 0.16 delta, mid | 167 | 83% | 1.18 |
| 30–45 DTE, 0.16 delta, taker | 166 | 79% | 0.80 |
| 30–45 DTE, 0.16 delta, hold | 167 | 95% | 1.79 |
| 1–4 DTE, 0.16 delta, mid | 380 | 81% | 0.77 |
Read the first two rows together. Same setup, same 167-ish trades, and the win rate barely moves — 83% against 79%. The win rate is not where the damage shows up, which is why it is such a poor summary statistic for a premium-selling strategy. The damage lands in the profit factor, because crossing the spread taxes every trade and taxes the losers on the way out as well. Above 1 means gross wins exceeded gross losses over the tested period; below 1 means they did not. The fill assumption alone moved this configuration across that line.
The fourth row matters for a different reason: the short-dated 1–4 DTE configuration prints 0.77 at the mid — the optimistic assumption — over 380 trades. When a config cannot clear 1.0 under the friendlier convention, fills are no longer the interesting question about it.
The hold row is a third exit convention rather than a third fill assumption: it carries the position to expiry instead of closing it, and prints both the highest win rate (95%) and the highest profit factor (1.79) of the group. That is the shape you would expect when an exit fill is removed from the accounting — though our record does not decompose the difference, so this is a pattern, not a proven cause. Either way: the most flattering number in a backtest grid is usually the one that assumes away a transaction.
The follow-up that overturns the easy lesson
If the story stopped at QQQ, the takeaway would be “always model taker fills.” So the desk ran the same comparison on a different underlying, explicitly to test whether QQQ’s fill drag was a liquidity quirk.
| SPY / XSP config (2020–2026) | Trades | Win rate | Profit factor |
|---|---|---|---|
| SPY 30–45 DTE, 0.16 delta, mid | 292 | 76% | 0.76 |
| SPY 30–45 DTE, 0.16 delta, taker | 292 | 77% | 0.79 |
| XSP 30–45 DTE, 0.16 delta, taker | 179 | 37% | 0.12 |
On SPY the fill assumption moved profit factor from 0.76 to 0.79 — a difference small enough to be noise, and pointing in the opposite direction from QQQ’s. The fill drag that destroyed the QQQ result did not exist here in any meaningful size.
That is the finding. Not “model fills pessimistically,” but: the fill assumption’s cost is a property of the instrument and the structure you are trading, and you cannot know its magnitude without measuring it on real quotes for that instrument. A generic slippage haircut applied across a portfolio of backtests will be far too small in some places and irrelevant in others, and it will look equally rigorous in both.
The XSP row is the same lesson at the extreme end: 179 trades, a 37% win rate, a profit factor of 0.12 under a pessimistic-fill assumption on a thinner contract — and no change to the strategy logic.
Why this breaks the standard advice
Most backtesting material handles fills in one line: “add slippage and commissions.” That is fine for a liquid equity, where the spread is a penny and the assumption barely moves the result. It fails quietly for options, for three reasons:
The spread is a large fraction of the edge. A credit spread might collect a premium measured in tens of cents. If each leg’s bid/ask is several cents wide, the round trip consumes a visible share of the theoretical credit before the underlying moves at all.
A multi-leg structure multiplies the crossing. A four-legged round trip pays the spread four times. Slippage assumptions built for a single-leg instrument understate a spread strategy by construction.
Spread width varies with everything that matters. It widens in the conditions that also produce your losing trades, so a fixed haircut models the calm-market spread and applies it to the stressed-market trades — exactly backwards.
The fill assumption is not a rounding detail bolted onto a finished backtest. On a premium-selling strategy it is one of the primary variables, and a result reported without stating it is not a result.
What to demand of any options backtest — yours or a vendor’s
The checklist that came out of running the above, and a fair set of questions to put to any published options-backtest result — including ours, and including anything produced by an LLM-generated strategy workflow, where the fill convention is the variable nobody specifies:
- What price did each fill get, exactly? Mid, mid-minus-haircut, bid/ask, or a modelled fraction of the spread. If the answer is not stated, the result is not interpretable — the same standard behind our published regime read method: state the rule and the inputs, so the number can be recomputed instead of trusted.
- Where did the quotes come from? Real NBBO bid/ask, or a theoretical price generated from a volatility model? A backtest priced off a model has no spread in it at all, so it cannot express this problem in the first place.
- Was the same test run under both conventions? One number tells you what the author assumed. Two tell you what the assumption is worth — and the distance between them is the honest confidence interval on the whole exercise.
- Does the reported win rate carry the argument? In our QQQ rows it moved four points while the verdict inverted. A high win rate on a premium-selling strategy is close to definitional. A premium tally can flatter even more: a 1%-a-week put-selling scoreboard that divides premium by cash cannot record a losing week at all.
- What happens at the exit? Configurations that hold to expiry avoid an exit fill entirely. That is a legitimate way to trade; it is not a like-for-like comparison against a config that closes early.
- Was it tested on more than one underlying? Our QQQ-versus-SPY split is the argument for this one: a fill-sensitivity finding on a single instrument is a finding about that instrument.
Frequently asked questions
Should I use mid or taker fills in my options backtest?
Run both. The point of this exercise is not to pick the “right” convention — it is that the distance between the two results is itself the measurement. If your strategy survives the taker assumption, the fill question is settled for it. If it only works at the mid, you have learned that your edge and your execution quality are the same size, which is a different and much more fragile proposition.
Does a high win rate mean an options strategy works?
Not on its own. In the runs above, the QQQ 30–45 DTE configuration won 83% of trades at the mid and 79% as a taker, yet the profit factor crossed from 1.18 to 0.80 between those two rows. Selling far out-of-the-money premium produces a high hit rate almost by construction; what determines the outcome is the size of the losses relative to the wins.
Why not just apply a fixed slippage number to every trade?
Because our SPY and QQQ runs disagreed about how large that number should be, on the same structure over the same period. A single haircut applied across instruments is an assumption wearing the costume of a correction.
What is a profit factor?
Gross winning P&L divided by gross losing P&L over the tested period. Above 1.0 means the wins outweighed the losses historically. It is a summary of a simulation, not an expected return, and it does not describe what a strategy would do next.
Two closing caveats, both load-bearing. These are historical backtest simulations over a stated 2020–2026 window, on our own research rig — not live results, not a prediction, and not advice. And they are not a verdict on put-credit spreads as a strategy; they are a verdict on how a backtest of one gets reported. The reason we publish the method and the failure modes alongside the numbers is the same reason behind our tool-trial protocol: a result you cannot interrogate is a result you have to take on trust, and this one changes sign depending on a single line in the configuration. Naming the fill assumption is one step of seven in how we validate a strategy before it trades a dollar.