The Claude Trading Bot Playbook: What the Viral Backtest Won't Tell You
A viral Claude trading bot playbook turns a prompt into a Pine Script strategy in an afternoon. Here is what its backtest cannot measure, with receipts.
Prompting Claude for Pine Script and backtesting it in TradingView produces almost no evidence about whether the resulting strategy is real. It is a genuinely fast way to produce one — the generation step is the easy half — but every hard question a strategy has to survive lives in the four or five configuration lines the playbook never asks you to specify.
This is not an argument that the workflow is a scam, and it is not a claim about anyone’s results. It is a walk through the workflow as it is commonly described, followed by the specific places where our own desk records show a result flipping on something that workflow never mentions.
The playbook, and what each step is missing
The workflow shows up in many versions across social feeds and video walkthroughs, usually attached to a large self-reported profit headline. The left column is our description of the genre — not a quotation of any author’s list, and we name no one. The right column is what each step would have to include before its output counted as evidence.
| The viral loop, as the genre states it | What that step is missing |
|---|---|
| 1. Describe a trading idea to an LLM in plain English. | Nothing. This step has genuinely collapsed, and the enthusiasm about it is not misplaced. |
| 2. Have it write the idea as a Pine Script strategy. | An audit of the price series underneath: pre-inception padding, and which adjustment basis the source applies. |
| 3. Paste the script into TradingView and run the strategy tester. | The fill convention, stated explicitly and re-run under both mid and taker pricing. |
| 4. Feed the results back and ask the model to improve them. | Held-out data the tuning loop never sees; until then the curve is provisional. |
| 5. Repeat until the equity curve looks good, then run it. | An unattended paper period with an end date, least-privilege keys, and kill conditions written down in advance. |
Step 5 in particular is our characterisation of where the loop usually terminates, and it is the step this article argues hardest against. If that framing is unfair to a version you have seen, the sections below still stand on their own: each is about a variable the workflow leaves unspecified, not about anyone’s phrasing.
On the headline profit numbers attached to these posts: we have not verified any of them, and we are not asserting any of them is false. They are self-reported, and absent an independently auditable trade record that is the whole of what can responsibly be said — the same bar our own tool trial protocol holds this desk to. Our argument does not depend on any number being wrong — it applies identically to a workflow reporting nothing at all.
The problem is that removing the bottleneck did not remove the reason it existed.
Step 3’s hidden variable: the fill assumption
The strategy tester gives you a number. It does not prominently ask what price your fills got, and that single unstated choice can be worth more than the strategy. Our own comparison ran on six years of real ThetaData NBBO option quotes covering 2020 through 2026 — put credit spreads, 30–45 days to expiry, 0.16 short-leg delta, roughly weekly entries — with the two underlyings tested on separate runs and therefore separate trade counts:
| Underlying | Trades, mid / taker | Win rate, mid / taker | PF at the mid | PF as a taker | Effect of the fill convention |
|---|---|---|---|---|---|
| QQQ | 167 / 166 | 83% / 79% | 1.18 | 0.80 | Profitable becomes unprofitable |
| SPY | 292 / 292 | 76% / 77% | 0.76 | 0.79 | Noise, pointing the other way |
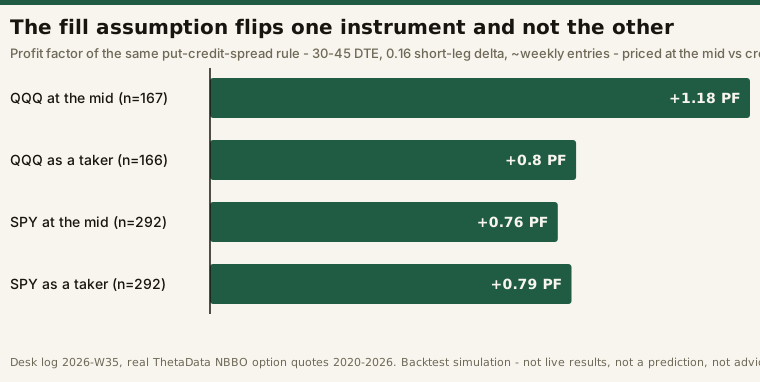
Historical backtest simulations from our own research runs over the period stated — not live results, not a prediction, not advice.
Two details in that table matter as much as the profit factors. The runs are different sizes — the SPY comparison holds 292 trades per configuration against QQQ’s 167, so the two rows are not equally weighted evidence. And the QQQ pair is 167 against 166: one trade differs between the mid and taker runs, so “identical entries and exits” is very nearly true rather than exactly true, and we are not going to round that away on a page about unstated assumptions. Note also that the win rate barely moves in either pair while the profit factor crosses 1.0 in one of them — win rate is a poor summary statistic for a premium-selling rule.
The QQQ row is the eye-catching one; the SPY row is the useful one. “Just subtract a slippage haircut” is not a correction, because the size of the haircut is itself the variable under test and it is a property of the instrument. The full working, and the chart, live in options backtest fill assumptions.
So ask the workflow’s output which convention it used. We cannot tell you what TradingView’s strategy tester defaults to, and will not guess: this desk’s open TradingView trial covers charts, the screener and alerts, and has logged no in-platform strategy-tester session at all. Read the value off the Properties panel yourself before you read the equity curve. A curve whose fill convention you cannot name is not a measurement.
Step 4 is the overfitting step
“Feed the results back and ask it to improve them” is a plain-language description of fitting parameters to the test set. Run it enough times and you will get a good-looking curve out of noise, reliably, because that is what the loop is optimising for. The model is not doing anything wrong; it is doing exactly what was asked.
The discipline that answers this is boring and unavoidable: hold out data the tuning loop never sees, and treat a result as provisional until it survives there. Walk-forward testing is the formal version, and it is step three of the seven checks we run before a strategy trades a dollar.
A single pass through the strategy tester has the evidential weight of one observation, and our own logs keep demonstrating how little that is — the n=2 problem, where a tidy first-session pattern in our API measurements was struck rather than carried forward once the second session contradicted it, is worked through in running an autonomous trading agent. Step 4 takes an observation of that weight and feeds it back in as an input.
Step 2’s blind spot: the data underneath
A strategy is only as honest as its price series, and price series lie in ways that produce no error message. Our own migration acceptance work caught a source back-padding a leveraged ETF with 117 sessions of flat, repeated closes dated before the fund existed — no flag, no error, and a backtest ingesting them sees 117 consecutive sessions of zero volatility. The record and what it cost are in backtesting pitfalls on real data.
The point for this workflow is narrower: we caught it because the migration had an acceptance step comparing results against a prior source. A loop that never leaves the strategy tester has no such step, and nothing in it will ever raise the question.
The adjacent question is adjustment basis. Our records note that split-only and split-plus-dividend daily series agreed to three decimals on low-yield instruments and diverge on high-yield ones — so “which adjustment does my source apply?” is not a technicality on a dividend-paying name.
Step 5’s gap: nothing in a backtest has latency
A backtest fires at a bar. Live, something has to reach you, and how long that takes is neither zero nor constant: our alert-delivery instrumentation found that the most popular moments to set an alert — round minutes — are measurably the slowest moments to receive one. Stated to the limit of what the log supports: on three of the four fully reconciled sessions (2026-09-03, 2026-09-08 and 2026-09-09 — the fourth, 2026-09-11, also captured every expected minute of 390 but has not been analysed for boundary effects), the median latency of alerts landing on a five-minute boundary ran 1.70x, 1.90x and 2.01x the median of every other minute, n=78 on-boundary alerts per session. The ratio replicated three times; the significance test was run once. On 2026-09-03 the on-boundary median of 2.570s against 1.515s off-boundary cleared a 20,000-shuffle permutation test (seed 12345, one-sided) at 0 of 20,000 shuffles at or above the observed gap, p < 0.00005. The other two passes recomputed the ratio and nothing else. That is a three-session ratio and a one-session p-value, and they are different claims. At coarser boundaries — every 15 or 30 minutes, top of the hour — only the direction has replicated; the observed top-of-hour penalty ranged from 1.68x to 10.44x across those same three sessions, a factor of six, so this desk publishes no multiplier for them at all. The distribution, the controls and the caveats are in running an autonomous trading agent.
A backtest that assumes action at the bar close assumes away a delay that is largest at precisely the times most strategies act. That is a structural gap in the artifact step 3 produces, not a defect anyone introduced.
Measurements of this shape are bounded by alert capacity rather than by anything clever: TradingView’s free Basic tier allows 3 active price alerts, alongside 1 chart per tab, 2 indicators per chart and 5K bars of history (read off tradingview.com/pricing on 15 September 2026, unchanged from our previous read — check it yourself, these change). Instrumenting hundreds of alerts across a single session needs more headroom than that. That capacity boundary — not any single feature — is what puts a measurement of this shape on a paid plan: TradingView.
The step nobody writes down: handing an API key to a model
Step 5 ends with “then run it,” which quietly means giving generated code the ability to move money — a different risk category from a bad backtest, deserving its own rules rather than an implicit yes.
The guardrail we actually run under, from our own trial method: the Alpaca probe rig operates against the paper endpoint only, with the constraint written into the method before the first run rather than added after a scare. Everything the automation is permitted to do is bounded by a credential that cannot reach real money.
The general form of the discipline, applicable to any generated bot:
- Paper first, with an end date. An agent that has never run unattended in a paper account for a stated period has not been tested; it has been imagined.
- Least-privilege keys. Separate read and trade keys. No withdrawal permission, ever.
- Kill conditions specified in advance. “Halt if the account deviates by X” is a rule. “I’ll watch it” is not.
- Read the code, and log enough to reconstruct any decision. The strategy tester validates the idea’s arithmetic, not the script’s behaviour when a broker returns something unexpected.
If the key reaches your broker through an MCP server instead of through generated code, the same discipline sorts into three permission bands — read-only, order entry, funds movement — which we take apart in broker MCP servers: what an AI agent can and can’t touch. What one of those community servers actually returns when you install and run it is in our desk test of TradingView + Claude over MCP.
So is the workflow worth running?
As a way to get from an idea to a testable artifact in an afternoon: yes, and the speed is not hype. As evidence that the artifact makes money: no, and the gap between those two sentences is the entire subject. Every item in the right-hand column of the table above can only remove strategies — which is why they get skipped, and exactly why they carry the information.
Frequently asked questions
Can Claude actually write a working Pine Script strategy?
Yes, for rule-based ideas that can be stated clearly. But “working” means it compiles and executes the rules you described. It says nothing about whether those rules have an edge, which is a separate question answered by evidence the script cannot generate about itself.
Are the viral profit claims real?
We do not know, and neither does anyone who has not seen an audited trade record. Our position is that this is anyway the wrong question: a workflow that produced a real result once and a workflow that produces overfit curves reliably look identical from a single screenshot. Ask instead what fill convention the curve assumed and what data the tuning loop never saw — those are answerable.
What’s the minimum extra work that makes this defensible?
Two things. Re-run the backtest under a pessimistic fill assumption and see whether it survives; then hold out a slice of history the tuning loop never saw and check it there. Between them they remove most of what step 4 manufactures.
Isn’t a paper account just delaying the real test?
It is the only way to find the failure modes that have nothing to do with your strategy — malformed responses, scheduling faults, intermittent data fields, delivery delays. Those show up identically in paper and live, and finding them in paper is free.
Disclosure: this page contains an affiliate link. If you subscribe through it, this site may earn a commission at no additional cost to you. It does not change anything stated above.
This is educational content, not financial advice. The backtest figures cited are historical simulations from our own research over stated periods — not live results, not predictions, and not a recommendation of any strategy or tool.