1% Weekly Options Income From Selling Puts: What the Scoreboard Can't Show
Why a 1% weekly put-selling scoreboard can't show a losing week, how to mark the position to market instead, and what ratio rolls hide. With code.
A “1% weekly” put-selling scoreboard that divides premium collected by cash occupied can’t show a losing week, as long as every roll is done for a net credit. The account can still be losing money every one of those weeks, and the only way to see it is to mark the open short puts to market at what it would cost to buy them back.
This is a study of a reporting method, not of a person. The prompt was a public r/thetagang series, “1% Weekly Returns from Options, Week 30”, which reports its results as weekly premium-over-cash returns. Nothing below is advice, and nothing below is a prediction of what selling puts will earn.
Why premium over cash can’t go negative
The metric is simple:
# The two per-week numbers this whole page is about
scoreboard = premium_collected_this_week / cash_occupied   # can never be < 0 when rolling for credit
true_ret   = equity_now / equity_last_week - 1             # equity = cash + shares - buyback cost of open shorts
The numerator is premium collected. Selling an option always collects premium. When a short put goes deep in the money, the usual repair is to roll it: buy it back and sell a later (and often lower-strike) put for more than the buyback cost. If the roll is done for a net credit, the week’s premium is positive, so the week’s row is positive.
The loss sitting in the open position never enters the numerator. It’s still there. It just isn’t in the column.
The second line is the fix. Equity counts the cash, any shares you were assigned, and subtracts what it would cost to close every open short at the ask that week. That buyback term is exactly what the premium tally leaves out.
A worked example: three positive weeks, a 30% loss
Here’s the mechanism on one hypothetical position. These are invented round numbers chosen to show the arithmetic, not market data and not a backtest. A $20 stock, $1,900 of cash securing one $19 put sold for $0.19 (1% of strike). Then the stock falls, and each Friday the put is rolled for a credit, adding contracts when a 1:1 roll can’t pay one:
# Hypothetical illustration. Per-share prices; 1 contract = 100 shares.
# Sells fill at the bid, buybacks at the ask.
weeks = [
    # (stock, buyback of expiring puts, contracts sold, new strike, new put bid, new put ask)
    (20.00, 0.00, 1, 19, 0.19, 0.21),   # week 0: open the position
    (16.00, 3.00, 1, 19, 3.15, 3.25),   # week 1: 1:1 roll for a credit
    (15.00, 4.00, 2, 18, 3.10, 3.20),   # week 2: 1:2 ratio roll to keep the credit
    (14.00, 4.00, 3, 17, 3.10, 3.20),   # week 3: 2:3 ratio roll
]
cash, contracts, equity_prev = 1900.0, 0, 1900.0
for wk, (px, buyback, n_new, strike, bid, ask) in enumerate(weeks):
    paid, received = buyback * contracts * 100, bid * n_new * 100
    cash += received - paid
    contracts = n_new
    scoreboard = (received - paid) / (strike * contracts * 100)
    equity = cash - ask * contracts * 100
    print(wk, f"{scoreboard:+.2%}", f"${equity:,.0f}", f"{equity / equity_prev - 1:+.1%}")
    equity_prev = equity
Output, tabulated:
| Week | Stock | Contracts short | Cash occupied | Scoreboard (premium/cash) | Equity (marked at ask) | True weekly return |
|---|---|---|---|---|---|---|
| 0 | $20.00 | 1 | $1,900 | +1.00% | $1,898 | −0.1% |
| 1 | $16.00 | 1 | $1,900 | +0.79% | $1,609 | −15.2% |
| 2 | $15.00 | 2 | $3,600 | +6.11% | $1,514 | −5.9% |
| 3 | $14.00 | 3 | $5,100 | +2.55% | $1,324 | −12.5% |
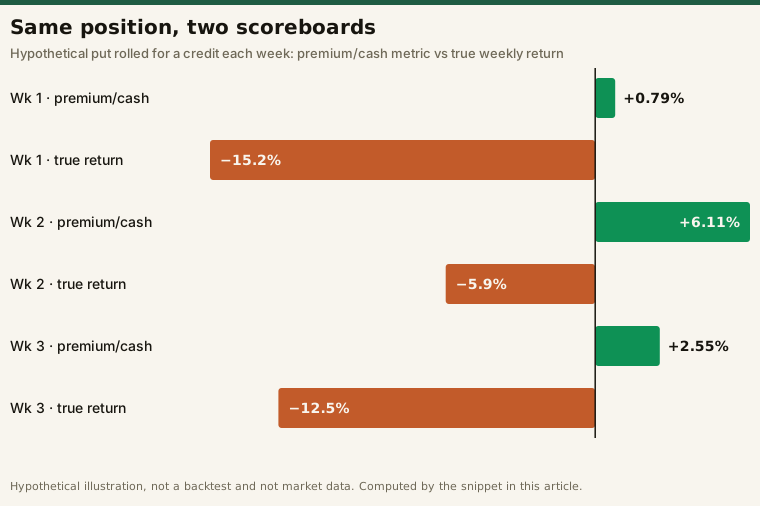
Every scoreboard row is positive. Week 2, the best-looking week at +6.11%, is the week the position doubled in size into a falling stock. Over the three weeks, marked-to-market equity went from $1,900 to $1,324, down 30.3%. (The example also glosses over something a real account can’t: the ratio rolls tie up $5,100 of collateral against $1,900 of starting cash, so the extra has to come from somewhere else in the account.)
We re-ran the method on real option quotes
The example is constructed. To see whether the same gap shows up on real prices, we ran the method as a backtest simulation over 121 Fridays from 7 June 2024 to 25 September 2026, on ThetaData end-of-day option bid/ask quotes for all 20 names on the post’s week-30 screener list (2,347 option-chain snapshots).
The series itself states only three rules: trade from a screener list, roll for a credit, and after assignment sell calls at the assignment price. Everything else below is the desk’s assumption, not the series’ rule:
- Entries (desk assumption): each Friday, sell next-week puts at delta −0.12 to −0.21 paying at least 1% of strike, as the stand-in for the series’ screener list; delta backed out of the quote with Black-Scholes at r = 4%. Up to 8 positions of about $12,500 each, targeting about $100,000 cash-secured.
- Rolls (desk assumption for the ladder and the cap): roll in-the-money expiring puts for a net credit to an equal or lower strike, allowing a 1:1, then 1:2, then 1:3 ratio roll, with cash occupied capped at $125,000. If no credit roll exists, take assignment and sell weekly calls at the assignment price (the series’ rule).
- Fills (desk assumption): taker fills (sell at the bid, buy at the ask) and mid fills, each run with ratio rolls allowed and with 1:1 rolls only.
- Splits: three corporate actions fall inside the window (MSTR 10:1 forward, FCEL 1:30 reverse, ASST 1:20 reverse). The simulation closes a name at real quotes on the last Friday before its split and reopens nothing in it until the Friday after.
- Measurement: both lines of the first snippet above, every week.
Backtest simulation — not live results, not a prediction, not advice. Results for the four variants, from the desk-log record:
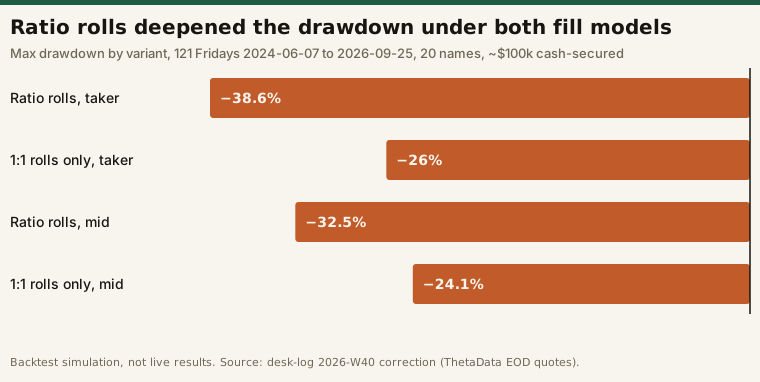
| Variant (20 names, split-safe) | Premium/cash negative weeks | True negative weeks | True total | True CAGR | Max DD | Ratio rolls | Assignments |
|---|---|---|---|---|---|---|---|
| Taker (bid/ask), ratio rolls = the series’ roll style | 0/121 | 60/121 | +66.5% | 24.8% | -38.6% | 24 | 15 |
| Mid fills, ratio rolls | 0/121 | 45/121 | +152.5% | 49.5% | -32.5% | 19 | 17 |
| Taker, 1:1 rolls only | 0/121 | 53/121 | +85.4% | 30.8% | -26.0% | 0 | 37 |
| Mid fills, 1:1 rolls only | 0/121 | 45/121 | +113.5% | 39.0% | -24.1% | 0 | 25 |
The premium/cash column recorded zero losing weeks in every variant. Marked to market, the same books lost money in 45 to 60 of the 121 weeks.
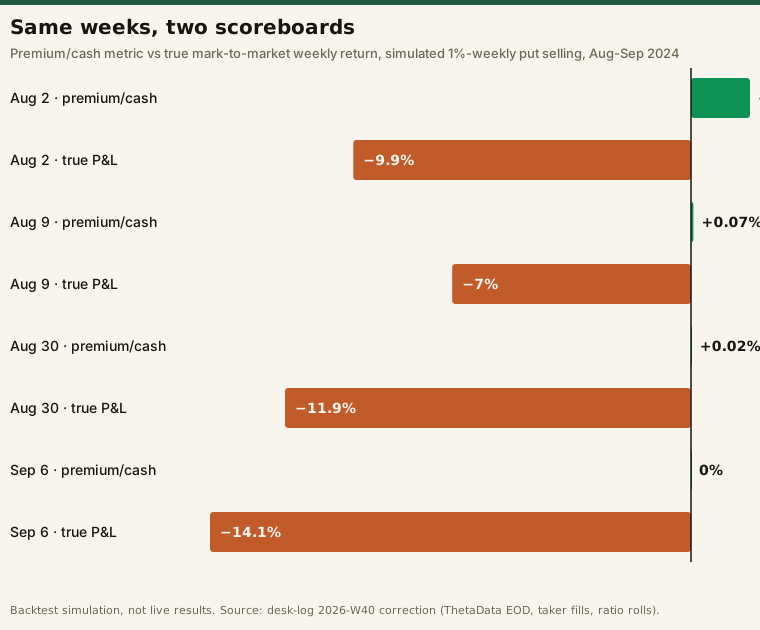
The divergence was sharpest in the August–September 2024 volatility spike, before the live series began. In the taker-fill, ratio-roll variant:
| Week ending | Premium/cash metric | True weekly return |
|---|---|---|
| 2024-08-02 | +1.73% | -9.9% |
| 2024-08-09 | +0.07% | -7.0% |
| 2024-08-30 | +0.02% | -11.9% |
| 2024-09-06 | +0.00% | -14.1% (worst week) |
What ratio rolls did depends partly on the fill model. The drawdown finding holds under both: with the same fills, allowing ratio rolls deepened max drawdown (−38.6% vs −26.0% at taker fills; −32.5% vs −24.1% at mid). The return finding does not: at taker fills, ratio rolls produced a lower total (+66.5% vs +85.4%), but at mid fills they produced a higher one (+152.5% vs +113.5%). Mid fills beat taker fills in both roll styles; why that happens in short-premium backtests has its own page, options backtest fill assumptions, so it isn’t re-argued here.
Survivorship warning. The universe is today’s high-IV screener list applied backward. Names that were hot in 2024 and have since faded aren’t in it. That flatters both the strategy and any buy-and-hold comparison on the same names, which is why this page doesn’t print one: neither is a fair verdict on selling puts in general. For more on how the data you choose can decide a backtest before the rules do, see what real data did to our backtests.
Ratio rolls: the martingale inside the credit
A ratio roll sells more contracts at a lower strike so the roll still pays a credit. It keeps the scoreboard positive, and it increases size into a losing position. That’s the martingale pattern: double down so the tally never shows a loss.
The worked example shows why it’s tempting. By week 3 the only roll that pays a credit is 2:3, because a 1:1 roll of a deep in-the-money put rarely pays enough extrinsic value to cover the buyback. The alternative, taking assignment, realizes the loss where you can see it. The ratio roll defers it and makes it larger, and the premium column records the deferral as income.
Why “1% a week at low delta” means very high volatility
Earning 1% of strike in a week on a put that’s well out of the money is only possible when implied volatility is very high. So a screener that filters for “1% premium at low delta” is, in practice, sorting by IV, one of the limits no screener interface removes: it returns what matched the filter, not a view on the names. That’s how a book built on the rule ends up concentrated in the most volatile names of the moment, which are also the names most likely to gap through a short strike.
How to read any “X% a week” series
- Find the numerator and the denominator. If the numerator is premium collected, the metric can’t go negative while rolls are done for credit.
- Ask for mark-to-market equity week by week, including the cost to close every open short at the ask.
- Count the ratio rolls. Each one is a size increase into a loser, and it’s invisible in a premium tally.
- Check the IV of the names. 1% a week at low delta requires very high implied volatility, so the book will be concentrated in the most volatile stocks available.
- Check which market regime the series has lived through. A run that started after the last volatility spike hasn’t been tested by one.
The discipline in how we validate a strategy, stating the rule and the costs before looking at the result, applies to reading other people’s scoreboards too. What an options data vendor does and doesn’t provide for this kind of test is covered in our ThetaData review.
Frequently asked questions
Can you really make 1% a week selling puts?
A premium/cash scoreboard can show 1% a week while the account loses money, because the scoreboard counts premium collected and ignores the cost of buying back open shorts. In the hypothetical example on this page, three positive scoreboard weeks coincided with a 30.3% fall in marked-to-market equity. Whether any real put-selling approach makes money depends on true equity, not on the premium column.
Why does a put-selling “Return %” never show a loss?
Because it divides premium collected by cash occupied. When a losing put is rolled for a net credit, that week still records positive premium. The unrealized loss on the open short only appears if you mark the position to market at the cost of buying it back.
Are ratio rolls a good way to repair a losing short put?
They keep the credit coming by increasing size into a losing position, which is a martingale pattern. In our backtest simulation (121 Fridays, June 2024 to September 2026, the 20 names on a public 1%-weekly series’ screener list, entry sizing and roll ladder assumed by the desk), allowing ratio rolls deepened the max drawdown under both fill models: −38.6% vs −26.0% at bid/ask fills and −32.5% vs −24.1% at mid. Their effect on total return depended on the fill assumption: lower at bid/ask fills, higher at mid. Backtest simulation — not live results, not a prediction, not advice.
What data do you need to test a put-selling strategy properly?
Historical option bid and ask quotes for every strike you’d trade, not last-trade prices, so that both the sale and the buyback can be priced honestly. The reasoning is covered in options backtest fill assumptions.
Does this mean put selling doesn’t work?
No. It’s a study of how one scoreboard reports results. It shows that a premium/cash metric can’t reveal drawdowns, not whether any particular put-selling approach will make or lose money.