Trading Tools Workflow: How Screener, Chart and Journal Chain Together
A trading tools workflow is three jobs in order: the screener narrows, the chart decides, the journal grades. The value sits in the handoffs.
A working trading tools workflow is three distinct jobs run in a fixed order: a screener reduces the whole market to a shortlist, a chart turns one name on that list into a specified decision, and a journal freezes the reasoning before the outcome is known so the decision can be graded later. Almost every tool roundup ranks these as three separate product categories to shop in — but the failures we can actually document happen in the handoffs, not inside any of the three tools.
This page is about the chain, not about which product to buy. It names no prices and recommends no platform.
The three jobs, stated precisely
Each stage answers a different question, and each one is bad at the other two’s job. Being explicit about that is most of the benefit:
| Stage | The question it answers | Its critical property |
|---|---|---|
| Screener | Which names are worth looking at right now? | No opinion and no memory. It returns a snapshot of description matches — never a view on whether trading them is a good idea |
| Chart | What would I actually do with this one? | It produces a specification — entry condition, invalidation, size, horizon — and a specification is checkable in a way an impression is not |
| Journal | Was that decision any good, independent of how it turned out? | The only stage with memory, and so the only one that can say anything about the other two |
Two of those properties do most of the work. The screener’s lack of memory is why a shortlist can never be a verdict. The journal’s memory is why it is the only place a verdict can eventually come from — and it only works if the record is written before the outcome is known, because memory silently reconstructs trades to match their results.
The chart stage is also the only one where market context enters, which for us is a separate and deliberately independent read rather than something the screener supplies — our version is documented in the regime read method.
The handoffs are where the workflow actually lives
Three tools that never exchange anything are three hobbies. What makes this a workflow is that each stage passes something specific forward — and each handoff has a documented way of failing.
Screener → chart: what has to travel with the ticker?
The obvious thing to carry forward is the list of names. The non-obvious thing — and the one we have watched break — is when the screen ran.
Two mechanisms in our own daily screen runs make a screen’s output a function of its run time rather than of the bar it describes. One name was dropped from a run for a market-capitalisation field that came back empty and ranked fourth the next day once the field was populated, with nothing about the company changed — the null-metadata failure mode is worked through in full on our backtesting-data page. Separately, re-reading a finished session’s volume three times moved one name’s relative volume from 1.80 to 1.95 against an unchanged 20-session mean — the post-close revision is documented with the read-by-read table on our autonomous-agent page.
The consequence for the handoff is concrete: a threshold has a settling period, and a screen run immediately after the close is reading numbers that are not final. A name at 1.48 post-close can be at 1.57 by morning, appearing in one run and not the other.
So the artifact that moves from screener to chart is not a list of tickers. It is a list of tickers plus the timestamp and the exact filter set that produced them. Without those, you cannot reproduce the shortlist later, which means you cannot ever fairly review it.
Chart → journal: what survives review?
The chart stage’s output is the journal’s input, and the transfer has to happen before the position resolves. That is the entire mechanism — it is not a filing preference.
What survives review is anything a later reader can check without knowing the result: the entry trigger and the level, the invalidation and the level, the size and how it was derived, the horizon, and the market state you believed you were in. What does not survive is the sentence that only makes sense afterwards. “Looked strong” cannot be graded; “entering above the prior day’s high, out below the 20-day average, half size because volatility read elevated” can be graded whether it won or lost.
The awkward but valuable addition is the candidates you rejected. Without them your journal records a strategy of “trades I took,” which is not the strategy you are running.
Journal → screener: what does the return leg actually change?
This is the return leg, and it is the one most setups never build. The journal is the only component with memory, so it is the only component that can tell you your screener is producing garbage.
The return leg’s first question is not “did the shortlist make money.” It is the cheaper, earlier one: what did each filter actually remove? That is answerable from the screen archive alone, without a single trade.
A loop closure, start to finish
Here is one full pass around the chain, using our own screen archive for the legs we have records for and a constructed entry for the leg we do not publish.
Leg 1 — the screen runs, and its own removals are counted. The desk’s preset is three conditions: close above the 20-day SMA, relative volume above 1.5x the prior-20-session mean, market cap above $2B. Run against S&P 500 constituents on the 2026-09-09 bar, the accounting looked like this:
| Stage of the preset | Names | Share of universe |
|---|---|---|
| Universe screened | 503 | 100% |
| Above its own 20-day SMA | 105 | 20.9% |
| Relative volume above 1.5x | 48 | 9.54% |
| Passing both conditions | 8 | 1.6% |
| Removed by the $2B cap gate | 0 | 0% |
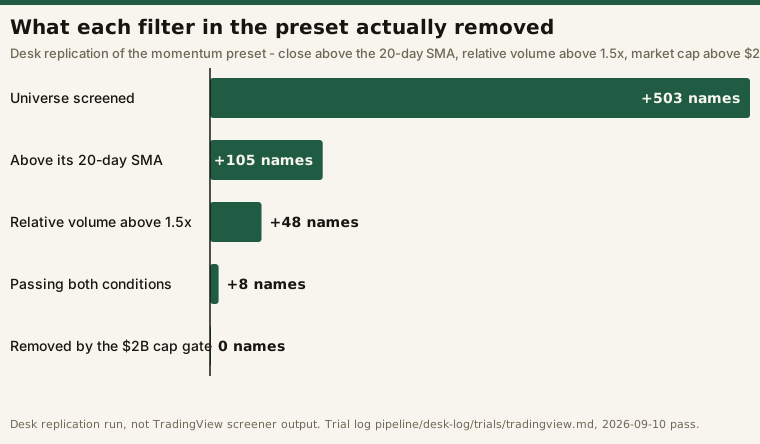
All figures are for that single bar under exactly those three parameters; change any threshold and every row changes with it. The two condition counts do not add up to the pass count because they overlap — the funnel is an intersection, not a subtraction, which is the arithmetic most screener interfaces never show you:
# Illustrative accounting of one screen pass, 2026-09-09 bar, 503 S&P 500 names.
# Rule: close > 20-day SMA AND rel_volume > 1.5 AND market_cap > 2e9.
universe        = 503
above_20sma     = 105          # condition A alone
rel_vol_over_15 = 48           # condition B alone
passing_both    = 8            # A AND B
dropped_by_cap  = 0            # of the 8, how many the size gate removed

# What the cap gate contributed to the shortlist, as a share of the screen's work:
print(dropped_by_cap / passing_both)        # -> 0.0
# Why "A + B" is not the answer: the overlap, not the sum, is the shortlist.
print(above_20sma + rel_vol_over_15)        # -> 153, a number that means nothing
print(passing_both / universe)              # -> 0.0159
Leg 2 — the chart turns one passer into a specification. Nothing about the shortlist is a decision yet. A name comes off it, gets a trigger level, an invalidation level, a size and a horizon attached, and those numbers exist on paper before anything is committed.
Leg 3 — the journal freezes that specification. This is the leg we do not publish: this desk reports no trades, positions or results, so the entry below is a constructed illustration of the shape, not a record of anything traded.
ILLUSTRATIVE journal entry — format only, not a trade we took or a recommendation.
date/time     : 2026-09-09 post-close
source        : momentum preset run @ 2026-09-10 12:00Z, bar 2026-09-09
                (close>20SMA, relvol>1.5, cap>$2B) — 8 of 503 passed
candidate     : <one of the 8>
trigger       : above prior day's high
invalidation  : below the 20-day average
size rule     : half unit — volatility read elevated
horizon       : 5 sessions
market state  : regime read taken separately, same bar
rejected      : <the other 7, with the reason each was passed over>
Leg 4 — the screen changes, or it doesn’t. This is where the loop closes, and on our own preset it closed twice.
First, the size filter. Across nine consecutive sessions the $2B market-cap gate never once bound — it never failed a single name on an actual size test, and its only observed effect was silently deleting names whose metadata happened to be missing when the screen ran. A filter that removes nothing it was designed to remove and something nobody asked for is a filter with a defect, and only a session-by-session archive could show that.
Second, the direction problem. Because the preset combines a price-versus-average condition with a relative-volume condition and no direction filter, a name that fell nearly 3% on the day ranked fourth on one run, and the same behaviour reproduced on a second independent session. High-volume declines rank highly in a screen built that way. That is a property of the preset, not of any vendor’s software — and it is invisible from inside a single day’s output.
Neither finding would have appeared in the screener’s interface, because a screener has no memory to look back with. Both are changes to the screen, arrived at from the record — which is what the return leg is for.
Where the chain breaks
A stage does another stage’s job. The commonest version is asking the screener for conviction — treating a shortlist as a buy list because the criteria felt strategic. A screen returns a description match. Every judgement is downstream of it.
A handoff is verbal. If what moves between stages lives in your head, the chain has no record and the return leg is impossible. The test is simple: could someone else re-derive today’s shortlist next month from what you wrote down? The same requirement applies to a backtest archive, for the same reason — see the run-timestamp problem.
The loop is open. A screener whose output nothing ever grades will drift for months without anyone noticing, exactly as our size filter did. An open loop feels productive because all three tools are being used.
What this implies for choosing tools
Two consequences worth having before you shop, both of which cut against how the category is usually sold.
First, the integration matters more than the feature counts. Three tools that pass timestamps, filter definitions and pre-trade specifications between them will beat three individually superior tools that do not, because the handoffs are where the compounding lives.
Second, an all-in-one platform is not automatically the answer. A single platform makes the screener → chart handoff nearly free, which is real — and unbundling it has its own costs, which we have written up separately in what you actually give up. But the journal is the stage where independence has value: a record the execution stack cannot silently revise is worth more than a convenient one, and a screen archive you can reproduce off-platform is worth more than one you can only view. Where those tensions land depends on how you trade, which is why we test tools against a fixed method before saying anything about them at all — the trial protocol.
The checklist
- Assign each of the three jobs to something specific, even if two of them are spreadsheets.
- Archive every screen with its run timestamp and its exact filter definitions, not just its results.
- Count what each filter removed on each run, not just what passed.
- Write the trade specification — trigger, invalidation, size, horizon, market state — before the outcome exists.
- Record rejected candidates alongside taken ones.
- Review the screener’s output against journal outcomes on a fixed schedule.
- Re-read at least one completed session’s numbers a day later; if they moved, your thresholds have a settling period.
Frequently asked questions
What is a trading tools workflow?
The ordered chain a trade passes through: a screener narrows the universe to candidates, a chart converts one candidate into a specified decision, and a journal records that decision before the outcome is known so it can be graded later. The tools matter less than the order and the information passed between them.
Do I need three separate tools?
No. You need the three jobs done in order, with the handoffs written down. A free screener, any charting package and a disciplined spreadsheet is a complete workflow; the free screener only stops being enough when one of its specific limits blocks a handoff. Three expensive tools with nothing passing between them is not.
Which stage should I fix first?
We have no comparison evidence that would rank the three, and anyone who offers you one without it is guessing. What can be said descriptively is narrower: the journal is the only stage with memory, so without it you have no record to judge the screener or the chart stage by — including no record of which stage is the weak one. That makes it the stage that supplies the evidence, not necessarily the stage with the most to gain from repair.
Should the screener tell me when to buy?
No. A screener returns names matching a description at a moment in time. It has no view on entry, size, risk or timing, and reading a shortlist as a recommendation is the single most common way this workflow fails.
How often should the screener’s criteria change?
Rarely, and only on evidence from the record. Changing filters after a bad week is fitting the screen to recent outcomes; changing them because a documented review showed a filter never fired — as our cap gate did not across nine sessions — or fired on the wrong thing, is maintenance.
This is educational content about tooling and process, not financial advice. No positions, signals, account values or trading results appear on this page; the screen behaviour described comes from our own instrumented replication runs, and the journal entry above is a constructed format illustration, not a trade.