When to Upgrade From a Free Stock Screener: The Triggers That Aren't Filters
Upgrade a free stock screener when delayed data, missing alerts, no export or page caps block a real job, not for filter count. What to check first.
Upgrade from a free stock screener when one of its limits blocks a job you actually do: acting intraday on delayed data, needing to be told when a screen matches instead of re-running it, needing the list outside the tool, or outgrowing what fits on a page. Filter count is rarely the reason. At Finviz, for example, the free tier already includes the screener, and the paywall sits on real-time data, alerts, export and interactive charts.
That changes how to decide. Don’t ask “does the paid version have more?” It always does. Ask which specific limit you’ve hit, and whether paying removes it.
Where the free/paid line actually sits: one worked example
Finviz is a useful example because its comparison table is unusually explicit. These rows are copied from the free-versus-Elite table on finviz.com/elite, read on 30 September 2026. Finviz isn’t in our link registry and we have no relationship with it.
| Feature (Finviz’s wording) | Free ($0, registered) | Elite |
|---|---|---|
| Market data | Delayed | Real-time |
| Stock quote data | Delayed | Real-time |
| Screener filters | Basic | Advanced |
| Saved presets | 50 | Unlimited |
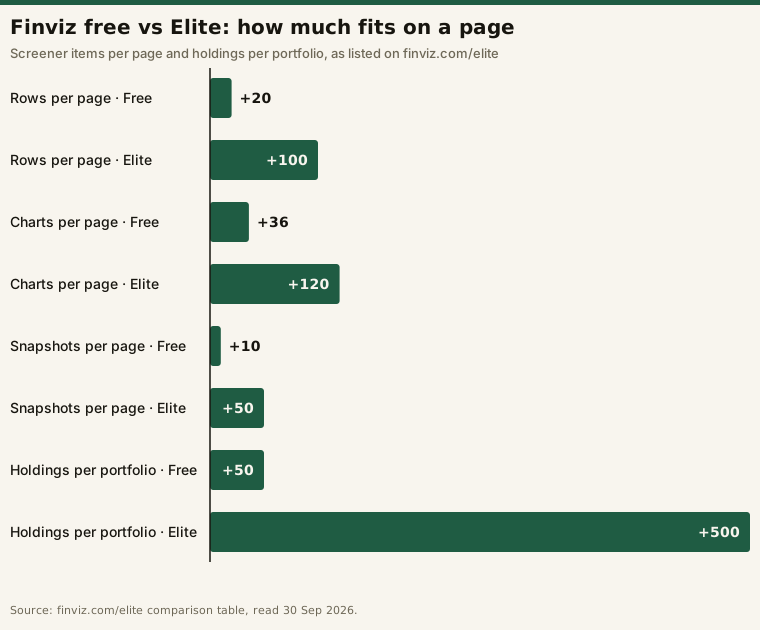
| Items per page (rows / charts / snapshots) | 20 / 36 / 10 | 100 / 120 / 50 |
| Auto-refresh | 3 min | 10 s |
| Interactive charting suite | Not included | Unlimited intraday charts |
| Stock, price, screener, portfolio & calendar alerts | Not included | Unlimited |
| Export to Excel, CSV | Not included | Included |
| Financial statements | 3 years | 8 years |
| Holdings per portfolio | 50 | 500 |
Elite was listed at $39.50 USD per month, or $299.50 USD per year, which the same page displays as $24.96/mo billed annually. Quote one basis and say which; the two numbers aren’t interchangeable.
Two things stand out. First, the free tier is a working screener, with basic filters and 50 saved presets. Second, most of the paid rows are about what happens around the screen: how fresh the data is, whether you’re notified, whether the result can leave the site. The volume rows show the same pattern:
TradingView draws its free/paid boundary differently, around active alerts, charts and watchlist symbols, and bars of history. That’s covered in TradingView free vs paid and isn’t restated here.
The five upgrade triggers
1. You make intraday decisions on delayed data
A screen is a snapshot of the data at the moment it runs. On a free tier, that data is typically delayed. How delayed is worth reading at the source. Finviz’s own answer is in the footer of its logged-out homepage, screener and Elite pages, read 30 September 2026: “Stock quotes delayed by 1 minute. Futures and options delayed by 15 minutes.” The comparison table itself says only “Delayed”, so read the current footer rather than a number quoted secondhand.
Delayed data is fine for an end-of-day routine and a poor basis for acting during the session. If you screen after the close and trade the next day, delayed data costs you nothing. If you screen at 10:15 and act at 10:16, it’s the first limit worth paying to remove.
The auto-refresh row is the same question at a smaller scale: three minutes between refreshes is irrelevant to a daily screen and a real constraint on a live watchlist.
2. You need to be told, not to look
A screener with no alerts only knows about matches when you run it. The screener, chart and journal workflow depends on that handoff: the screen produces candidates, and something has to tell you when a candidate reaches your level. If you find yourself re-running the same screen every hour to catch a match, you’ve hit the alert limit, and that’s a concrete reason to upgrade.
3. The list has to leave the tool
If your process continues somewhere else, whether a spreadsheet, a journal or a script, export decides whether that step is a download or retyping. On the Finviz table above, Excel/CSV export is paid-only. A screen you can’t export is a screen you can’t audit later, because you can’t compare today’s list against last month’s without having kept it.
4. Your screen outgrows the page
A screen that returns 60 names on a 20-row page is three page-loads of scrolling. A 50-holding portfolio cap matters if you track a whole index. These are the least glamorous limits and the easiest to test: count what your screen returns on a normal day and compare it with the caps.
5. A feature scales with the plan you hold
Some newer tools tie an allowance to the plan tier rather than a feature flag. TradingView’s AI Chart Copilot extension is the clearest case: its weekly allowance is listed as a multiple that rises with your TradingView plan, and the top rung is disputed between two primary sources. The details, and why a beta allowance is a weak reason to buy a plan, are in our Copilot write-up.
What paying doesn’t fix: data you haven’t checked
Upgrading buys fresher data and more capacity. It doesn’t buy you certainty that the data behind a screen is complete, and a free source can fail in a way that looks like a normal result.
We saw this on the desk’s own daily screen, which runs over the S&P 500 on a free data feed. The rule: close above the 20-day simple moving average, relative volume above 1.5 against the prior 20-session average, market cap above $2 billion, ranked by relative volume (the counts below were computed without the market-cap lookup, which wasn’t run on these passes). For the 22 September 2026 bar, a batch download returned a close for only 60 of 503 constituents. The market was open that day, so this was a hole in the feed, not a holiday:
| Bar | Names with data | Median rel-vol | ≥1.5× gate | Above 20-day SMA | Passers |
|---|---|---|---|---|---|
| 2026-09-21 | 503/503 | 0.981 | 37 | 131 | 11 |
| 2026-09-22 | 60/503 | 1.058 | 11 | 29 | 0, not a valid screen |
| 2026-09-23 | 503/503 | 0.975 | 46 | 131 | 7 |
The obvious failure was the 22nd. The quieter one was the 23rd. For the 443 affected names, the 20-day averages now spanned a window with a missing day, and pandas skips missing values without warning, so those names were averaged over 19 observations. The screen ran cleanly and returned a normal-looking seven passers anyway.
The feed later backfilled the missing day, and recomputing the 24 September bar on the repaired data changed its passer count from 10 to 9. The fix on our side was a census check before trusting any screen. It’s illustrative and simplified here:
# Illustrative: refuse to screen on a bar the feed didn't fully deliver.
import pandas as pd

def census_ok(closes: pd.DataFrame, bar, universe_size: int) -> bool:
    return closes.loc[bar].notna().sum() == universe_size   # 60/503 on 2026-09-22 -> False

def sma20_strict(closes: pd.Series) -> pd.Series:
    # pandas' rolling mean with min_periods=20 returns NaN instead of silently using 19 observations
    return closes.rolling(20, min_periods=20).mean()

# .mean() on a window with a NaN skips it without warning: 19 values, no error
print(pd.Series([1.0] * 19 + [float("nan")]).mean())   # 1.0, computed from 19 numbers
The point for an upgrade decision: before paying for more data, check whether the data you already have is complete. A paid tier changes the freshness row in the table above. It doesn’t remove the need for the census check.
A quick way to decide
- Write down the job. “Scan S&P 500 names after the close for a relative-volume breakout” is a job. “Better screening” isn’t.
- Find the limit that job hits. Delay, alerts, export, page caps, or a plan-scaled allowance. If none, stay free.
- Read that limit on the vendor’s own page, not in a comparison article. Third-party tier tables drift, and some are published by a competitor.
- Price it on one billing basis, monthly or annual, and name the basis.
- Check the trial terms before starting one. Finviz’s page says its free Elite trial requires a credit card and “automatically renews as a paid subscription after the trial” unless you cancel before it ends. It also says refunds are “issued during the initial 30-day period and upon a written request”.
For the basics of what a screener is and how to write one down as a fixed rule, see what is a stock screener. What natural-language filtering can’t fix is covered in AI stock screener limits. Whether your broker’s built-in AI screener can stand in for a paid one is covered in broker AI screeners vs standalone ones.
Frequently asked questions
Is a free stock screener good enough?
For an end-of-day routine, often yes. Finviz’s free tier, for example, includes the screener with basic filters and 50 saved presets. The free tier falls short when you need real-time data, alerts, export or larger pages, which is where Finviz puts its paywall.
What do you actually get by upgrading Finviz to Elite?
According to Finviz’s own comparison table, read 30 September 2026: real-time instead of delayed data, advanced filters, interactive intraday charts, unlimited alerts, Excel/CSV export, 100 rows per page instead of 20, 10-second instead of 3-minute auto-refresh, and 8 years of financial statements instead of 3. It was listed at $39.50 per month or $299.50 per year.
Should I upgrade for more filters?
Usually not. On Finviz’s own comparison table, the paid boundary sits mostly on data freshness, alerts, export and capacity rather than on the ability to screen at all. Upgrade when a specific one of those limits blocks a job you do.
Does paid data mean my screen results are correct?
No. Paid data changes freshness and coverage, but any feed can deliver an incomplete bar. Check that every name in your universe has data for the bar you’re screening before trusting the result. We document a case where a free feed delivered 60 of 503 closes for one session and the next day’s screen ran on short averaging windows without any error.
Is the Finviz Elite free trial really free?
Finviz’s page says a credit card is required to start the trial, and the trial “automatically renews as a paid subscription” unless you cancel before it ends. Read the current terms on the vendor’s page before starting.