No-Code Backtesting Software: What It Can and Can't Prove
No-code backtesting proves a rule ran mechanically on stored data. What that is worth, what it can never establish, and what the pricing tiers really gate.
No-code backtesting software proves one thing: that a rule you specified, applied mechanically to a stored price series, would have produced a particular sequence of simulated trades. That is useful, and far narrower than the category’s marketing implies. It cannot prove the rule has an edge, that the fills were achievable, or that the future resembles the sample.
Everything separating a good backtesting tool from a bad one sits in that gap. This page covers the gap first and the products second, because a feature list is a poor guide to a category whose main failure mode is believing your own output.
What “no-code” actually changes
A no-code backtester replaces a scripting step with a configuration step. You assemble conditions from dropdowns instead of writing them in a language, and the platform compiles that into the same loop a coded backtest runs: step through bars, evaluate entries, simulate an order, evaluate exits, record the result. Two things follow, and they are the whole practical story of the category.
It lowers the cost of asking a question. Not because coding is hard, but because testing an idea drops from an afternoon to a few minutes — so ideas get tested that would otherwise have stayed opinions.
It also lowers the cost of asking a bad question. The same speed that lets you test twenty ideas lets you test one idea twenty ways until a version looks good. Nothing in the interface distinguishes the two, and the second ruins more retail backtests than anything else.
The four things a backtest genuinely establishes
Be precise about the output; precision here is what stops you over-trusting it.
That the rule is fully specified. This is the most reliable value a backtester delivers. A strategy you can describe in conversation is usually ambiguous — what counts as a breakout, what happens when two signals collide, what you do on a gap. The engine will not run until each is decided, and many strategies die there, correctly, because there was no rule to begin with.
That the rule was mechanically executable on the sample. The engine applied your conditions without discretion, hindsight or hesitation.
Its behavioural shape. Trade frequency, holding period, the length and depth of losing runs. This is the most transferable output: a rule that goes fourteen trades without a winner is a different product from one that does not.
Where it breaks. Run the same rule across different periods, instruments and parameter values, and the useful information is not the best result — it is the range, and the conditions under which the thing stops working.
The four things it cannot establish, no matter what it costs
That the fills were achievable. Every backtest assumes a price at which your simulated order transacted. That is a modelling choice, and on anything spread-sensitive it can exceed the edge being measured — the same strategy flipped from profit to loss purely on the fill assumption in our options fill-assumption tests, which is where that result and its parameters live.
That the data is what you think it is. Split adjustments, dividend treatment, session boundaries, pre-inception padding, survivorship — these are properties of the feed, not the backtester, and they will happily produce a clean-looking curve from a corrupted series. Our write-up of what real data did to our tests is mostly a list of this kind of problem.
That the result is not a coincidence. Any sufficiently searched parameter space contains a combination that looks excellent on the sample. The engine cannot tell you how many combinations you tried before stopping — and that number is the most important input to interpreting the result. Only you know it, and only if you counted.
That it will work forward. A backtest is a statement about a sample; extending it requires assumptions about stability that no software supplies. The nearest defence is testing out-of-sample in a structured way — one of the checks in how we validate a strategy.
None of this criticises any particular product. They are properties of simulation.
What to check before you pay for one
Feature grids in this category are nearly interchangeable, so evaluate on what actually differs.
Three different “resolution” limits, and which one your question hits
Pricing pages flatten three separate ceilings into one word. The finest bar your charts draw, the finest timeframe your scanner can sweep, and the number of bars a single backtest can span are usually set independently, and they gate different questions. A backtest capped at 2,000 bars cannot carry a daily-bar rule across ten years; a scanner that only sweeps two-hourly cannot find a five-minute setup; neither has anything to do with whether the chart itself draws one-minute candles. Before concluding that a cheaper plan cannot answer your question, check which of the three it actually limits — vendors do not always gate the one you assume.
How fills and costs are modelled
Ask three questions: which price is the simulated fill taken at, can you impose commission and slippage, and what happens when a bar gaps through your order. The only honest way to use a backtest is to try to kill your own idea with it. The arithmetic is worth seeing once:
# Illustrative — simplified cost model, not any vendor's engine.
# Per-trade cost applied to a long round trip:
def net_pnl(entry, exit_, shares, spread, slippage_ticks, tick, commission):
    # cross the spread on both legs, then add adverse slippage
    fill_in  = entry + spread / 2 + slippage_ticks * tick
    fill_out = exit_ - spread / 2 - slippage_ticks * tick
    return (fill_out - fill_in) * shares - 2 * commission

# A rule averaging +$0.05/share gross on a $0.04 spread, 1 tick of slippage:
net_pnl(entry=50.00, exit_=50.05, shares=100, spread=0.04,
        slippage_ticks=1, tick=0.01, commission=1.00)   # -> -3.00
Gross edge of $5 a trade, net loss of $3. Nothing about the entry logic changed; only the assumption did.
Sweep the same function across gross edges and slippage settings and the shape of the problem is obvious — the rule with the thinnest edge is the one the assumptions decide, and a fatter edge is barely touched by them. Every cell below is that function called with a 100-share round trip, a $0.04 spread, a $0.01 tick and $1.00 commission per leg:
| Gross edge/share | Gross $/trade | Net, 0 ticks slip | Net, 1 tick | Net, 2 ticks |
|---|---|---|---|---|
| $0.05 | $5.00 | -$1.00 | -$3.00 | -$5.00 |
| $0.10 | $10.00 | $4.00 | $2.00 | $0.00 |
| $0.18 | $18.00 | $12.00 | $10.00 | $8.00 |
| $0.30 | $30.00 | $24.00 | $22.00 | $20.00 |
The $0.10 row is the one to read twice: it is profitable, marginal or exactly breakeven depending on a setting most people never open. A platform that will not let you set those three inputs cannot answer the only question that matters.
Whether results are exportable
Trade-by-trade export is the difference between a tool you can audit and a screen you must trust — and it determines whether you can leave. A platform that holds your test history with no export is charging a switching cost that is not on the price page.
Whether the parameter search is instrumented
A good optimiser reports the whole surface — how the result behaves across neighbouring parameter values — rather than handing you the winner. A broad plateau beats a single spike, and a tool that shows only the spike helps you deceive yourself efficiently.
The products, and what their pricing actually gates
TrendSpider is the product in this category built around automation rather than a chart you drive by hand: its own site describes it as “Automated technical analysis software” with market scanning, and states that its Strategy Tester requires no coding. Its pricing page, read on 2 September 2026, prices four plans and gates them on capacity rather than features:
| Plan | List price/mo | 14-day trial (list) | Finest chart bar | Minimum scanner timeframe | Backtest depth |
|---|---|---|---|---|---|
| Standard | $82 | $19 | 1 minute | 2 hours | 2,000 bars |
| Premium | $137 | $29 | 1 minute | 5 minutes | 10,000 bars |
| Enhanced | $183 | $39 | 1 minute | 1 minute | 20,000 bars |
| Advanced | $321 | $49 | 1 minute | 1 minute | 30,000 bars |
A sale was running as we read the page — “Life, Liberty & Leverage”, stated to end 10 September 2026, showing $51.30 / $54.60 / $61 / $107 a month and a $7 trial on every plan, with the discount advertised as covering the first 12 months rather than permanently. The table quotes list price deliberately: promotions on this vendor rotate, so a sale column is stale within days. Check the live page for whatever is running when you read this.
The page states that all TrendSpider features and tools are included at every level, with plans differing in usage capacity rather than feature access. That structure is unusual and worth understanding before you buy: you are not buying features, you are buying headroom.
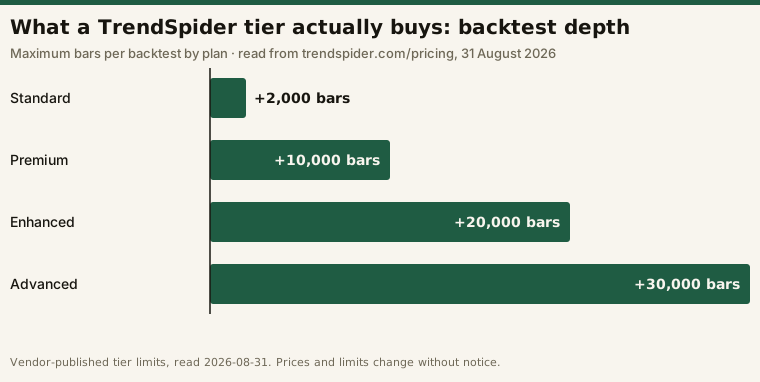
Read the two resolution columns together, because this is the part of the category most easily mis-sold — including by us, in an earlier version of this table. Every plan charts one-minute bars. Chart resolution is not what the ladder sells. What it gates is how finely the scanner sweeps the market — two-hourly on Standard, five-minute on Premium, one-minute from Enhanced up — and how many bars one backtest can span.
So the question is not “which features do I need”, and not “how fine a chart do I need” either. It is: how fine does my scan have to be, and how many bars does my test have to span — then buy the cheapest tier that clears both. Worked through: ten years of daily bars is roughly 2,520 trading days, which overruns Standard’s 2,000-bar cap and puts you on Premium for depth alone, even though a daily swing rule never needs a sub-daily scan. A one-minute rule inverts it — 30,000 one-minute bars is about seventy-seven US sessions, so even the top tier buys roughly a quarter of a year at that resolution.
TradingView approaches it from the other end — a charting platform with a scripting language, Pine Script (currently v6), and a Strategy Tester the vendor’s documentation describes as visualising “the hypothetical trading performance of a simulated strategy.” It is not strictly a no-code product; the power is in the language. It belongs here because for many people the real choice is “learn enough Pine to test this” versus “pay for a tool that does not require it”, and its free tier settles which of those you are. How to choose between the two approaches is covered in Pine Script vs no-code backtesting. Its tier limits are in free versus paid.
We have not run a controlled trial of TrendSpider, so this page makes no claim about how either product performs in use. When we do, it follows the tool trial protocol — and until then we will not tell you which is better.
How to use one without fooling yourself
The discipline is almost entirely about what you do before and after the test.
- Write the rule down before you test it, exits and edge cases included, and date it — the same reasoning that makes a trading journal worth keeping.
- Count your attempts. If you tested forty variants, you are looking at the best of forty, and you should say so out loud.
- Hold data back. Fix the out-of-sample period before you start, and do not look until you are done adjusting.
- Make the costs pessimistic. Set slippage and commission worse than you expect, as in the snippet above. If the result survives that, it is worth more attention; if not, you learned something cheap.
- Read the losing runs, not the headline. The longest losing stretch in the sample is your best estimate of what you would have to sit through, and it is probably an underestimate.
Frequently asked questions
Is no-code backtesting less rigorous than coded backtesting?
No — the rigour lives in the method, not the interface. A carefully specified visual test with pessimistic costs and a held-out period beats a sloppy coded one. What code buys is the ability to express rules the interface cannot.
Can a backtest tell me how much a strategy will make?
No, and any figure presented that way should be read as marketing. A backtest reports what a simulation did on a stored sample under assumptions you chose. We do not publish expected-return figures for strategies.
What is the minimum I should spend on backtesting software?
Start on a free tier or cheap trial, find your real constraint — usually bar resolution, history depth or export — then buy the cheapest tier that removes it.
How much price history is enough for a backtest?
Enough to include at least one market regime unlike the present one. A strategy tested only across a trending stretch has been tested against a single condition — which is why reading the regime matters before you interpret any curve.
How do I know which tier of a backtesting platform I need?
Work backwards from two numbers, not one. Multiply bars per session by the sessions you want covered and buy the cheapest plan whose backtest-depth limit clears it; separately, check the plan’s minimum scanner timeframe against the timeframe your setup lives on. Those two limits are often gated at different tiers, and chart resolution is frequently not gated at all.
Sources and read dates: all TrendSpider plan names, list prices, trial prices, sale prices and sale end date, the all-features-included statement, the per-plan charting and scanning minimum timeframes and the backtest depth limits were read from trendspider.com/pricing on 2 September 2026; the product description from trendspider.com on 31 August 2026. Pine Script v6 and the Strategy Tester description were read from tradingview.com’s Pine Script documentation on 31 August 2026. Vendor pricing and limits change without notice, and the sale quoted above is stated to end 10 September 2026.
Disclosure: this page contains affiliate links. We hold a TradingView partner link, and if you subscribe through it this site may earn a commission at no additional cost to you. We are not in TrendSpider’s affiliate program, so that link pays us nothing. No vendor reviewed this page or paid for placement, and no product here has been through a completed desk trial.
This is educational content about software, not financial advice. Nothing here is a recommendation to buy any product or to trade any strategy.